Download
1 / 32
320 likes | 542 Vues
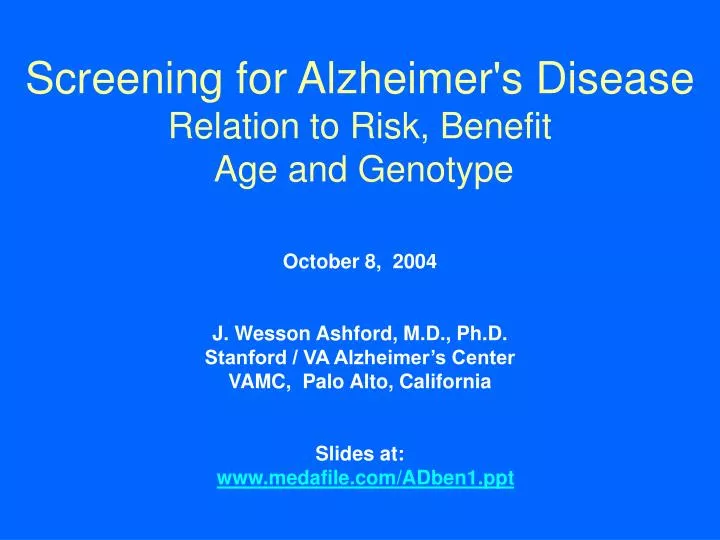
Screening for Alzheimer's Disease Relation to Risk, Benefit Age and Genotype. October 8, 2004 J. Wesson Ashford, M.D., Ph.D. Stanford / VA Alzheimer’s Center VAMC, Palo Alto, California Slides at: www.medafile.com/ADben1.ppt. Why Diagnose AD Early?.

E N D
Screening for Alzheimer's DiseaseRelation to Risk, Benefit Age and Genotype October 8, 2004 J. Wesson Ashford, M.D., Ph.D. Stanford / VA Alzheimer’s Center VAMC, Palo Alto, California Slides at: www.medafile.com/ADben1.ppt
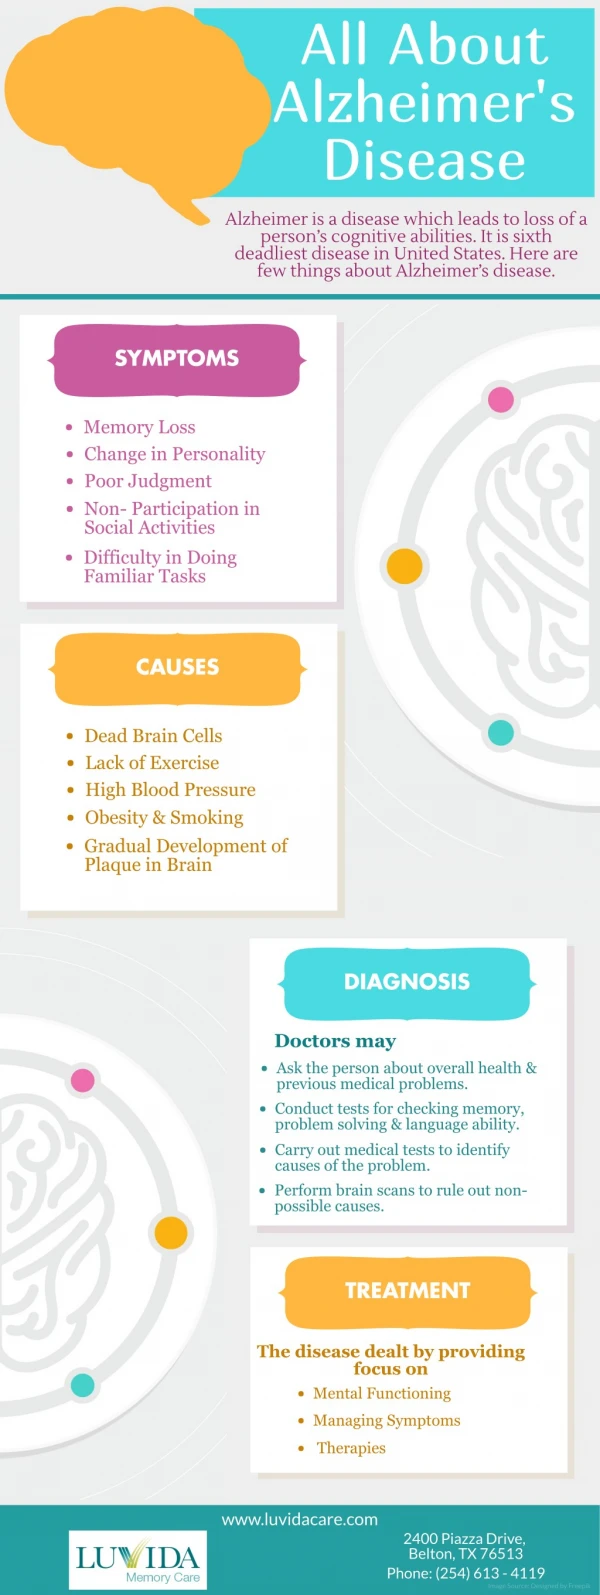
Why Diagnose AD Early? • Safety (driving, compliance, cooking, etc.) • Family stress and misunderstanding (blame, denial) • Early education of caregivers of how to handle patient (choices, getting started) • Advance planning while patient is competent (will, proxy, power of attorney, advance directives) • Patient’s and Family’s right to know • Promotes advocacy for research and treatment development • Specific treatments now available • May slow underlying disease process, the sooner the better • May delay nursing home placement longer if started earlier • May prevent conversion from Mild Cognitive Impairment to AD
BRIEF CLINICAL TOOLS FOR COGNITIVE ASSESSMENT • MINI-MENTAL STATE EXAM • CLOCK DRAWING • ANIMAL NAMING (1 minute) • MATTIS DEMENTIA RATING SCALE • ALZHEIMER’S DISEASE ASSESSEMENT SCALE (ADAS) • ACTIVITIES OF DAILY LIVING • GLOBAL CLINICAL SCALE • CLINICAL DEMENTIA RATING SCALE • GLOBAL DETERIORATION SCALE / FAST
Available Screening Tests • MMSE 10 -- 15 min • Too long • 7-Minute Screen 7 – 10 min • Too complex • Clock Drawing Test 2 – 4 min • Not sensitive • Mini-cog 3 – 5 min • Complex scoring, unclear adequacy • Memory Impairment Screen 4 min • Need for slightly shorter, easier test • (a suitably accurate test that takes less than 2 minutes is not available)
Need to Develop Better Screening and Early Assessment Tools • Genetic vulnerability testing (trait risk) • Vulnerability factors (education, occupation, head injury) • Early recognition (10 warning signs) • Screening tools (6th vital sign in elderly) • Positive diagnostic tests • CSF – tau levels elevated, amyloid levels low • Brain scan – PET – DDNP, Congo-red derivatives • Mild Dementia severity assessments • Detecting early change over time • predicting progression, measuring rate
Yesavavage et al., 2002 Markov Chain model
ALZHEIMER’S DISEASE AAMI / MCI DEMENTIA Ashford et al., 1995
Brief Alzheimer Screen (BAS) • Repeat these three words: “apple, table, penny”. • So you will remember these words, repeat them again. • What is today’s date? • D = 1 if within 2 days. • Spell the word “WORLD” backwards • S = 1 point for each word in correct order • “Name as many animals as you can in 30 seconds, GO!” • A = number of animals • “What were the 3 words I asked you to repeat?” (no prompts) • R = 1 point for each word recalled BAS = 3 x R + 2/3 x A + 5 x D + 2 x S Mendiondo et al., J Alz Dis 5:391, 2003
Mendiondo et al., 2004 JW Ashford, MD PhD, 2001
CONCLUSIONS on the BAS • A single cut-off score provides reasonable sensitivity and specificity for the diagnosis of AD within 2 – 3 minutes • Two cut-off points divide the population into 3 tiers • the first cut-off indicates a low likelihood of dementia • the second indicates a high likelihood of dementia • the remaining group falls into a ‘gray area’ in need of closer scrutiny, follow-up, and more extensive testing • A suitably short screen can be administered yearly to individuals over 60 y/o as a 6th vital sign • Next direction – use of IRT to locate level of impairment
MEMTRAX - Memory Test(to detect AD onset) • New test to screen patients for AD: • World-Wide Web – based testing, • CD-distribution • KIOSK administration • Determine level of ability / impairment • Test takes about 1-minute • Test can be repeated often (e.g., quarterly) • Any change over time can be detected • Free test is at: www.medafile.com
Issues in Screening • ROC analysis provides independent values for how the screening test values affect the normal and patient populations, then plots their relationship with respect to each other (specificity vs sensitivity respectively) • The value of the test must be calculated with respect to the risk of the disease • Risk is affected by age, genotype, many other factors • Accounting for a priori probability is Bayesian analysis • The cost of the applying the test and the costs of false positive and false negative results as well as the benefits of correct positive and negative results must be assessed • Alzheimer’s disease is not a dichotomous diagnosis in early stages, but a continuum, which would be better assessed with a probabilistic statement, that would be better calculated from Item Response Theory • Item Response Theory allows combination of many items
RELATIVE RISK FACTORS FOR ALZHEIMER’S DISEASE • Family history of dementia 3.5 (2.6 - 4.6) • Family history – Downs 2.7 (1.2 - 5.7) • Family history - Parkinson’s 2.4 (1.0 - 5.8) • Maternal age > 40 years 1.7 (1.0 - 2.9) • Head trauma (with LOC) 1.8 (1.3 - 2.7) • History of depression 1.8 (1.3 - 2.7) • History of hypothyroidism 2.3 (1.0 - 5.4) • History of severe headache 0.7 (0.5 - 1.0) • NSAID use or statin use 0.2 (0.05 – 0.83) Roca, 1994, t’Veldt, 2002
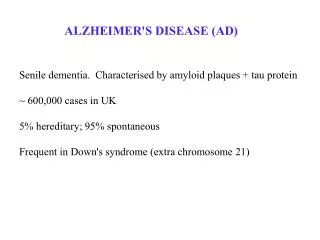
Genes and Alzheimer’s disease(60% - 80 % of causation) • Familial AD (onset < 60 y/o) (<5%) • all known autosomal dominant genes relate to b-amyloid • Presenilin I, II (ch 14, 1) • APP (ch 21) • Non-familial (late onset) • APOE • Clinical studies suggest 40 – 50% due to e4 • If e2 is considered, may be 95% of causation • Population studies suggest 10 – 20% cause • Evolution over last 300,000 to 200,000 years • At least 20 other genes suspected of relating to AD Ashford & Mortimer, 2002, J. Alz. Dis. 4:1-9.
APO-E genotype and AD risk46 Million in US > 60 y/o //// 4 Million have AD(data from Saunders et al., 1993; Farrer et al., 1997) Ashford & Mortimer, 2002, J. Alz. Dis. 4:1-9. Raber, Huang, Ashford, 2004, Neurobiol Aging. 25:641-650
Mortality Equationst = age in yearsTd = time for mortality rate to doubleRo = mortality rate at time zeroalpha = ln(2) / Td • Mortality rate u(t) R = Ro x exp (alpha x t) • Survival curve s(t) S = exp ( - Ro/alpha x (exp (alpha x t) –1 )) • Number of deaths per year d(t) D = -ds/dt = ( Ro + alpha x ln (1/s(t) )) x s(t) = u(t) x s(t)
Are we ready to do genetic testing to predict AD? • The family members want it • They consider recommendations against genetic testing to be “paternalistic” • Family members can make more powerful financial decisions based on this knowledge than the relevance of insurance companies implementing changes in actuarial calculations • Those at risk can seek more frequent testing • This is the best opportunity for early recognition • Those at risk will be better advocates for research • Specific preventive treatments can be developed for each genetic factor
Control: What happens without testing? Total Population Risk=P P’ P Have AD No effective intervention Do not have AD Helena Kraemer, 2003
Testing: What happens with testing? Total Population P’ P AD No AD Se Se’ Sp’ Sp Unnecessary intervention OK No effective intervention Effective intervention $ Testing $Testing $ Testing $ Testing $ Intervention $ Intervention Iatragenic Damage? Clinical Wash Clinical Wash Clinical Gain Major(?) Loss Minor (?) Loss Minor(?) Loss Major(?) Gain Helena Kraemer, 2003
Cost – Benefit Calculation • I = incidence P = Total Population • X = cost of test, time to take (subject, ? Tester) • Sn = sensitivity of test = 1- False negative (Fn) • Sp = specificity of test = 1- False positive (Fp) • Cost: • Total cost of test = P*X • Fp = $1000 * P * (1-I) * (1-Sp) (+false hope) • Tn = 0 (real peace of mind) • Fn = false peace of mind • Tp = (-$49000 * P * I * Sn) => $50,000 = NH cost/1year • Avg Person Benefit= 49000*I*SN -X -1000*(1-I)*(1-Sp)
Future Directions for Alzheimer’s Disease • Need more precise assessment of cognition from normal to severe dementia • Need to use Item Response Theory and Computerized Adaptive Testing • Screening tests need to be widely used, that implement computer administration • Test analyses need to be risk/benefit-related • Better tests will lead to better treatments • Better treatments will lead to prevention