Download
1 / 184
1.89k likes | 2.14k Vues
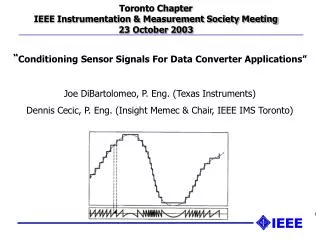
Toronto Chapter IEEE Instrumentation & Measurement Society Meeting 23 October 2003. “ Conditioning Sensor Signals For Data Converter Applications” Joe DiBartolomeo, P. Eng. (Texas Instruments) Dennis Cecic, P. Eng. (Insight Memec & Chair, IEEE IMS Toronto). First Half of Presentation

E N D
Toronto ChapterIEEE Instrumentation & Measurement Society Meeting 23 October 2003 “Conditioning Sensor Signals For Data Converter Applications” Joe DiBartolomeo, P. Eng. (Texas Instruments) Dennis Cecic, P. Eng. (Insight Memec & Chair, IEEE IMS Toronto)
First Half of Presentation Introduction to IEEE Toronto & IMS Chapter Introduction to IEEE Std. 1242-2000 (DC) Fundamentals of Signals & Analog-to-Digital Conversion (DC) Analog-to-Digital Conversion Methods Flash (DC) Pipelined (DC) Successive Approximation (DC) Sigma-Delta (JD) BREAK!! Second Half of Presentation Analog-to-Digital Converter Specifications & Terminology (DC) Sampling Specs AC Specs DC Specs ADC Support Circuitry (JD) Signal Conditioning Circuitry RC buffer circuit Choosing & Using Voltage References Clock Jitter Anti-aliasing filter Draw for ADS8343 EVM Analog/Digital De-Coupling (Time Permitting) (JD) Technical Presentation Agenda
IEEE Toronto Instrumentation & Measurement Society Executive • Chapter Chair: Dennis Cecic, P. Eng. Field Applications Engineer Insight Memec Toronto. d.cecic@ieee.org • Chapter Vice-Chair: Florin Gagiu, M.Sc. Senior Member of Technical Staff MD Robotics fgagiu@mdrobotics.ca
IEEE: Networking the World • World’s largest technical professional society • More than 350,000 members in 183 countries. • IEEE Mission: • Foster technological innovation • Enable members’ careers • Promote community worldwide IEEE members have advanced the profession, and develop technologies that benefit humanity.
Fostering Technological Innovation IEEE produces nearly 30% of the world’s literature on electrical engineering, electronics & computing. • A publishing program of periodicals, books, standards, conference proceedings, electronic products & mixed media • For people, not for profit • Over 300 annual IEEE conferences • Over 700 standards development groups • 36 Technical Societies & 2 Technical Councils
Key IEEE Publications • Spectrum Magazine - award winning monthly publication • The PROCEEDINGS of the IEEE • Flagship journal of the IEEE • Provides in-depth coverage of emerging technologies • IEEE/IEE Electronic Library (IEL) - 32% of world’s current literature in electrical engineering and computer science. • Accessible for $35 (US) per month for members • Download up to 25 articles/month
Aerospace & Electronic Systems Antennas & Propagation Broadcast Technology Circuits & Systems Communications Components, Packaging, & Manufacturing Technology Computer Consumer Electronics Control Systems Dielectrics & Electrical Insulation Education Electromagnetic Compatibility Electron Devices Engineering in Medicine & Biology Engineering Management Geoscience & Remote Sensing Industrial Electronics Industry Applications Information Theory Instrumentation & Measurement Lasers & Electro-Optics Magnetics Microwave Theory & Techniques Nuclear & Plasma Sciences Oceanic Engineering Power Electronics Power Engineering Professional Communication Reliability Robotics & Automation Signal Processing Social Implications of Technology Solid-State Circuits Systems, Man, & Cybernetics Ultrasonics, Ferroelectrics, & Frequency Control Vehicular Technology IEEE Technical Societies(Active Toronto Sections Highlighted)
IEEE Toronto Section • The oldest IEEE section outside the US (formed Sept 30, 1903) • Celebrating our 100th anniversary this year! • Schedules technical meetings/seminars on a monthly basis • Events are promoted via monthly E-mail newsletter • To subscribe, please visit our web site: www.tor.ieee.ca • Many previous presentations available.
About the IEEE Instrumentation & Measurement Society • The IEEE Instrumentation and Measurement Society is dedicated to the development and use of electrical and electronic instruments and equipment to measure, monitor and/or record physical phenomena. • The field of interest includes • Metrology (the science and practice of measurement) • Analog and digital electronic instruments • Systems and standards for measuring and recording electrical quantities - in both frequency and time domains • Instrumentation and transducers for measurement of non-electrical variables, • Calibration and uncertainty, • Instruments with automated control and analysis functions, • Safety instrumentation, • New technology applications. • IEEE Std 1241-2000 was developed by the Waveform Measurement & Analysis Technical Committee of the Instrumentation & Measurement Society
Local Chapter Educational Themes We are motivated by the challenge of modern electronic product development and will schedule meetings around the following themes: • Embedded Electronic System Design • Enabling Technologies • Best Design Practices in Instrumentation Design • Sensor signal conditioning and data conversion • High speed signal propagation & circuit design issues • Real-time DSP System Design issues • Innovation & Product Development (Best Practices) • Creating and Protecting New Ideas • Organizing People, Money, Resources to get the job done right the first time
Past Meetings (PDF’s available at www.tor.ieee.ca) • June 5, 2003 Designing Sensor Signal Conditioning with Programmable Analog ICs • January 29, 2003 Industrial Ethernet - Issues and Requirements • March 28, 2002, The Critical Success Factors: What Distinguishes Winning Businesses In Product Development • March 14, 2002, The Intel/Analog Devices Micro Signal Architecture: A 300MHz dual-MAC DSP Architecture for Next Generation Handheld Applications • January 23, 2002, Project Management For Project Success • October 25th, 2001, Protecting Your Company And Your Ideas: An Introduction To Intellectual Property Law For Engineers • March 22, 2001, Time-Frequency Analysis: a "Better" Fourier Analysis (Application to Knee-Joint Sound Signal Analysis)
IEEE Membership Dues • Basic membership ~ $200 CDN/yr • Additional costs depending on the number of technical societies/publications ordered • $15-$40/yr extra per society joined
Introduction to IEEE Std. 1242-2000 • Scope of the Standard • Other Standards Addressing ADCs
Introduction to IEEE Std 1241-2000 • IEEE Std 1241-2000: IEEE Standard for Terminology and Test Methods for Analog-to-Digital Converters • Result of the work of the Waveform Measurement & Analysis Technical Committee of the IEEE Instrumentation & Measurement Society • Identifies analog-to-digital (ADC) error sources and provides test methods with which to perform the required error measurements • Provides a basis for evaluating & comparing existing devices • Provides a template for writing specifications for new devices • Presents terminology & definitions to aid the user in defining and testing ADCs
Other Standards Addressing ADCs • IEEE Std 1057-1994 • Describes the testing of waveform recorders • Was used as a guide in writing 1241-2000 • IEEE Std 746-1984 • Addresses the testing of ADCs & DACs used for PCM television video signal processing • Standard is presently withdrawn (& being updated) • 1241-2000 addresses differential gain & differential phase testing of ADCs which will be digitizing color composite video signals • JESD99-1 (JEDEC Standard) • Deals with the terms and definitions used to describe ADCs & DACs • Does not include test methods
Fundamentals of Signals & Digitization • Components of Analog Signals • Distortion & Linearity • Fundamentals of Analog-to-Digital Conversion • Sampling of Analog Signals • Shannon’s Sampling Theorem • Basic Sampling Circuits • Sampling Dynamics • Quantization of Sampled Analog (Discrete Time) Signals • Quantizer Models • Linear Quantizer • Effects of Quantization • SNRq Derivation • Non-linear Quantizer • Coding of Quantized samples
What is a Signal? • A varying pattern that conveys or represents information about the state or behavior of a system • A signal can be a function of time (t) , or space (eg. An image) • All signals originating from the “real-word” are limited by the finite energy expended in their production, and will satisfy physical requirements of • Finite signal value (value does not diverge, no singularity) • Finite signal energy & power • Finite signal bandwidth (No step changes!) • Signals are broadly classified into two categories • Analog Signals (continuous amplitudes, defined for all time instants) • Digital Signals (discrete amplitudes, defined at specific time instants)
Analog, x(t) Continuous Amplitude Continuous Time Discrete, x(n) Continuous Amplitude Discrete Time Digital, xq(n) Discrete Amplitude Discrete Time Analog, Discrete, Digital Signals
Vpeak Vp-p Components of an Analog SignalTime Domain View Va = A sin(wt + ) +VDC • Amplitude • Frequency (period) • w : radian frequency (2f) • f : frequency (Hz) • t : time • : phase (radians) • VDC Offset Voltage • Period, T = 1/f T
Vpeak Vp-p Power Capability Measure:Deterministic (Periodic) Signals Va = A sin(wt + ) +VDC • Measure: “Average Instantaneous Power” (or “Mean Square” value, or “Variance” if mean=0) • Another Measure: RMS Value (or “Std Deviation” if mean=0)) • Equivalent DC voltage it would take to dissipate same average power T
Variance, s2 is a measure of the power represented by the deviation from the mean Can be computed from the signal samples directly: Or from the signal’s histogram: Used to estimate the power of a quantization error signal Power Capability Measure: Stochastic (Random) Signals
Components of an Analog Signal Frequency Domain View • DFT Real & Imaginary coefficients converted to polar format (magnitude&phase) • Frequency • may be log scale • Magnitude: • Sometimes expressed in RMS • Typically in dBFs • Phase (not shown): • degrees • radians
Components of an Analog Signal Any waveform can be described as a sum of multiple sinusoids. Any of these can be uniquely singled-out with appropriate filtering
Parseval’s Relation • The average instantaneous power of the complex periodic signal (in time) = the sum of the powers of all the harmonics (in freq.) • Makes sense..the frequency transform can’t contain more energy than present in the time domain!! • Significance: • Interpretation of ADC AC parameters derived from FFT measurements • More bins in the FFT result means that the same power is divided up among them, so the noise floor drops. • See article at http://www.chipcenter.com/eexpert/jhorn/jhorn022.html
Summary: Time vs. Freq. Domain Views Va = A sin(wt + f) +VDC • Time Domain View (Node-level) • Benefits: • Amplitude/offset/freq/phase easily read • Signal detail preserved (glitches/transients) • Weakness: • Complex freq. Behavior difficult to infer • Not suitable for wide range of amplitude orders (10:1 max) • Frequency Domain View (System-level) • Benefits: • Time-variation of complex freq. Behavior can be observed (in multiple FFTs) • Log scales show changes over several orders of magnitude • Weakness: • Signal transitions hidden in the phase information of all components
A Different View of Signals: Time-Scale • Wavelet analysis turns a function of time (t), into a function of scale and time • Analyzing functions are called “wavelets” • A “Mother Wavelet” is stretched or compressed during signal analysis • Allows a signal to be analyzed at different scales • Big wavelets give an approximate image of the signal • Smaller and smaller wavelets zoom in on the details
Wavelet Analysis In Action Basic analysis at 1 scale Wavelet transform over 5 scales Precise filtering of a complex waveform is possible by zeroing out the coefficients around a specific point and reconstructing the signal from the coefficients and mother wavelet
A Linear System: Sine wave in = Sine wave out Amplitude may be reduced Phase shifted A non-linear system will distort a signal Sine wave in = Sine wave out+Harmonics at integer multiples of the fundamental frequency This THD (Total Harmonic Distortion) of the signal is a measure of the linearity of the system Distortion and Linearity Imperfect (non-linear) system
SFDR = Spurious Dynamic Range Magnitude of the largest harmonic relative to the fundamental In this case, about 50dB = 0.32% THD = Total Harmonic Distortion Measure of the power of all harmonics relative to the fundamental (usually a full scale input signal) 1241-2000 THD Spec: compute for first 9 harmonics (h2 through h10) Metrics for Distortion
Noise Sources • Interference noise • External sources, not easily controlled • Inherent noise • Many sources (1/f, Thermal Noise, Op-Amp Noise, Quantization Noise, Aperture Noise…) Noise depends on the bandwidth you’re working with. @ room temp R in MW (f2-f1) in Hz To illustrate this over a 50-kHz range, the noise generated by a 10-k resistor is around 2.9 V. Reference voltage 2.7v 3.6v 5v m m m 1LSB 41.2 V 54.9 V 76.3 V 16- bit LSB resolution
Total Noise The combined effect of several random noise sources is found by root sum of the squares addition of the rms values of the separate noise sources. Etotal = ( E12 + E22 + E32 + ...) The largest noise sources are dominant. 18
System ‘Purity’ Summary • Linearity (THD or SFDR) • Is a measure of how much a system distorts a signal. • Dynamic Range or Resolution • is a measure of the largest signal a system can handle, to the smallest that can be discerned from noise, THD etc. • Both can be expressed in ‘bits’ • (i.e. how accurate would an A/D converter need to be to achieve the same linearity or resolution?) • 8 bit accuracy = 1 in 28 = 0.39% = -48dB • 12 bit accuracy = 1 in 212 = 0.024% = -72dB • 16 bit accuracy = 1 in 216 = 0.0015% = -96dB
The Analog/Digital Conversion Interface • In order to process an analog signal in the digital domain, we need to convert an analog signal to a digital signal via a process called analog-to-digital conversion, where sampling & quantization are the fundamental processes • In order to reproduce an analog signal after processing, we use the reverse process of digital-to-analog conversion, where interpolation is the fundamental process
Basic Analog-to-digital Conversion Blocks • Sampler • Samples the signal at discrete time intervals • Quantizer • Approximates the sampled voltage with a level from a fixed set of 2n possible voltage levels via ROUNDING or TRUNCATION • Encoder • Encodes the measurement in a convenient format for communication or processing • Real ADC’s also incorporate a serial/parallel data interface for the processor, and possibly a FIFO memory
Periodic Sampling of Analog Signals • In general, in the absence of any additional conditions, it is not possible to uniquely specify an analog signal from a sequence of equally spaced samples • an infinite number of signals can generate a given set of samples • In both examples, the output data from the ADC are the same for the different analog input signals.
The Sampling Theorem • Under certain conditions it is possible to reconstruct an analog signal perfectly • IF you bandlimit the input signal, AND • IF you sample the signal at least 2x the highest signal frequency component (The “Nyquist” Frequency) • THEN, you can reconstruct the sampled signal by convolving the samples with an SINC kernel (Ideal digital-to-analog transfer function)
Spectra of Periodic Sampled Signals – Nyquist Sampling (Borderline Aliasing in the Freq Domain) Impulse Sampling Natural Sampling (Zero-Order & Track/Hold are similar) • Sample as high as possible to minimize DAC output filter requirement! • Correction is required for DAC output to compensate for SINC distortion of ZOH!
Sampling Schemes • Impulse Sampling (Theoretical – not implemented in practice) • Natural Sampling (Theoretical - multiplier is a switch) • Zero-order hold Sampling (Ideal Sample/Hold - instantaneous acquisition time is impractical) • Track/Hold (Real Sample/Hold – Result is sampled and stored in a memory element)
So..What Frequency Do I Sample At??? • Generally, faster is better, but ... • Limited by physical constraints • Switch resistance • Amplifier settling time • Required component values • Rule of thumb:sample at greater than 10X signal BW • minimises sampling effects (amplitude distortion) • eases the anti-aliasing filter requirements (reduced filter order)
An analog filter is required to limit the BW of the input signal (as per the sampling theorem) The order of the filter depends on how close the cut-off frequency is to the Nyquist limit (Fs/2) The maximum variation in the passband must be less than the resolution of the ADC For a first order LPF Solving** for an 8-bit ADC, gives Signal BW< 1/10th of cut-off freq!! Message: Sampling theory is nice, but sample at as high rate as possible (at least 10x) Also consider sigma-delta as an alternative!! Anti-Aliasing FilterPassband Attenuation Considerations
A digital signal is a sequence of numbers (samples) in which each number is represented by a finite number of digits (finite resolution) The process of converting a discrete-time continuous-amplitude signal into a digital signal is called quantization The error introduced in representing the continuous-valued signal by a finite set of discrete values is called quantization error, or quantization noise Quantization of Continuous Amplitude Signals
“Linear” progression of quantization steps of “Uniform” width Max. input voltage = Vref Quantizer step width, D, refers to the minimum change in input to change output code by 1, given by ADC DC specs derived from non-ideal transfer function Unipolar, Linear, Uniform Quantizer (& Binary Coder)
Quantizer error signal depends on the input signal dynamic range and #quantization levels With high #levels, the error signal is modeled as an additive noise signal with a uniform probability distribution Quantization error signal power is given by it’s variance Effect of Amplitude Quantization
Derivation of SNR Derivation of SNR in deciBELs Real SNR affected by actual quantization noise PDF, as well as harmonics and aperture jitter Input Signal: Full Scale Sinusoid Peak ampl=Vref/2 Input signal power: Quantization noise power: SNRq: Quantizer Output Signal-to-Noise Ratio(Full Scale Sinusoidal Input)
Real ADC Errors • Real ADCs have other errors in addition to the nominal quantization error discussed • Divided into the categories of STATIC & DYNAMIC, depending on the rate of change of the input signal at time of digitization • STATIC errors usually result from non-ideal spacing of code transition levels • DYNAMIC errors occur because of the additional sources of error induced by the time variation of the analog signal being sampled • Harmonic distortion from the S/H stage • Signal-dependent variations in the sample instant • Frequency-dependent variation in the spacing of the quantization levels
Flash ? Analog-to-Digital Converter Methods of Conversion P-i-p-e-l-i-n-e-d D ¾S Delta - Sigma (Oversampling) Successive Approximation
Nyquist Rate Converters • Converters that generate a series of output values in which each value has a one-to-one correspondence with an input value • Note: These converters are seldom run at the Nyquist rate due to the difficulty in realizing practical anti-aliasing & reconstruction filters • In most cases, Nyquist rate converters operate at 1.5 to 10 times the Nyquist rate (i.e. 3 to 20 times the input signal’s bandwidth) • Examples: • Flash • Pipelined • Successive Approximation (SAR)
Oversampling Converters • Converters that operate much faster than the input signal’s Nyquist rate (typically 20 to 512 times faster) • Increase the output SNR by digitally filtering out quantization noise that’s not in the signal’s bandwidth • Use noise shaping to place much of the quantization noise outside the input signal’s bandwidth • Example • Sigma-delta
Nyquist vs. Oversampling • Major advantage of oversampling ADCs is that they allow the specifications of the input anti-aliasing filter to be relaxed • Lowers the implementation cost
Input signal is concurrently compared to all possible quantization levels 2N comparators, along with a voltage divider, generate 2N reference voltages Comparator outputs them passed through a “thermometer” decoder to produce an N-bit digital word Highest throughput (> 100MSPs) Med-to-low Resolution (8-10bits) Highest Power consumption Conversion Clk & Track/Hold not shown Flash ADC Architecture