Using Growth Models for Accountability
This presentation by Dr. Pete Goldschmidt explores the application of growth models in educational accountability, particularly under the No Child Left Behind (NCLB) framework. It examines how growth models can be utilized to monitor and evaluate student progress over time, contrasting them with traditional status models. The presentation discusses the limitations of status models, the importance of distinguishing between true and observed gains, and the need for reliable measurements of student performance. Key concepts such as cohort growth, vertically aligning scales, and implications for accountability practices are also highlighted.

Using Growth Models for Accountability
E N D
Presentation Transcript
Using Growth Models for Accountability Pete Goldschmidt, Ph.D. Assistant Professor California State University Northridge Senior Researcher National Center for Research on Evaluation, Standards, and Student Testing 86th Annual CERA Conference November, 2007 Dana Point, CA
Accountability • Status Models • Under NCLB • Growth Models • Growth Model Pilot under NCLB • Value Added Models
Purpose of Growth Models • Accountability • Focus on effects of: • Schools • Teachers • Evaluation and monitoring student progress • Monitor programs/interventions • Monitor student performance over time • As opposed to assessment which assesses students at a single occasion
Status Models as indicators of school Performance • Difficulty arises in that achievement tests results are based on cumulative processes and are confounded by four inter-related student factors: • Results related to current processes that are under teachers’ and schools’ control. • Time – Previous teacher/school effects impacts current performance. • Results related are to innate ability. • Results are related to factors outside of school control (e.g., a students home learning environment. Modern assessments attempt to maximize (1), while minimizing (2) thru (4); however items need to be examined to evaluate where items might fall in relation to (1), (2), (3), (4).
Status Models sunder NCLB • NCLB assumes that performance is entirely under teacher and school control in the current year. • Aggregate results are highly correlated with school enrollment characteristics. • Larger, more heterogeneous schools less likely to meet AYP targets.
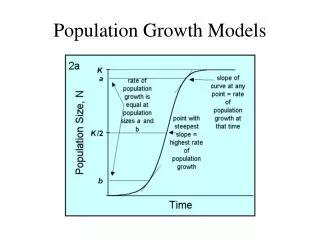
Growth Models as indicators of school performance • Define Growth • Cohort growth • Panel Growth • Gains • Multiple time points • Projections
Growth Models: using two assessments without underlying linkage
Gain scores provide a direct estimate of student growth • Some argue that gain scores are biased and inherently unreliable, but this is not necessarily true. • In fact gain scores can be more reliable than the underlying individual scores. • Often the unreliability associated with gain scores is due to small sample sizes and lack of variability in gains among students. • It is important to distinguish between true gains and observed gains. • Often observed gains are used and these tend to be spuriously (negatively) related to year one scores. • Year to year fluctuations may be to great too provide accurate indicators of school performance.
Vertically Aligning Scales • Measuring change has little meaning if the underlying latent construct has changed • If standards are generated independently from grade to grade, there is no way to ensure that performance standards progress in a developmentally appropriate way. • Assessments designed to measure skills in stand-alone courses can not be vertically equated. • E.G. if Mathematics content in one grade emphasizes calculations and problem solving in the next grade – can a unidimensional adequately capture a single construct?
Growth: precision and reliability • Precision • Describes how well an individual’s slope estimates his true rate of change. • Depends on the number and spacing of measurement occasions and on the psychometric properties of the test. • Any single student’s growth measured with error
Growth: precision and reliability • Reliability • Describes how much of the between-person variability in observed scores is attributable to variability in true scores. • Better reliability in rates of change estimates creates a better ability to detect true differences in trajectories among individuals (or groups). • Better precision generally leads to higher reliability • If there is little variation in true growth, then despite good precision reliability will be low (making it difficult to detect between person differences in growth)
Growth Models and accountability • Based on individual student data over time • Time within a grade span (in general) • Consider input factors • Aggregated to school for estimate of school performance • Aggregate growth to subgroups within schools • Examine performance gaps
Growth Models and accountability under NCLB • Use individual student data • Ignore student input factors • classify student into category (makes AYP etc) • Add classifications • Count students in categories • Performance gaps are based on numbers of students in various categories
Growth Models and accountability under NCLB • NCLB rules: • Assume growth estimates precise enough to have no substantive effect on classification • Assume student inputs are irrelevant to school’s ability to facilitate growth • Provide no estimate of the achievement gap, rather simply count of students in categories • Ignores within category growth (which is often greater than between category growth)
Growth Model types under the NCLB Pilot Program • Regression based • Estimated score growth • Estimated “satisfactory” growth • Gains based • Movement from one level to another • Projection based • Projected performance based on current performance (based on prior cohorts) • Value tables
Using assessment results as indicators of school and/or teacher performance • Single year scores are not good indicators of teacher or school performance because assessments results are confounded by time, ability, and home learning environment. • Results indicate that average school performance is highly correlated with average student background factors. • Unfettered rankings of schools simply ranks schools based on the distribution of student enrollment. • Better to compare schools that have similar characteristics like the API. • Indicators of school performance based on proficiency of multiple subgroups penalizes large schools (more likely to have more categories needing to meet requirements). No information regarding within category changes in performance.
Using assessment results to monitor student performance • Gains and growth begin to address limitations of status models • Growth trajectories provide estimates of the process of change • Individual trajectories may not have enough precision for classification • Individual trajectories should be used to estimate subgroup and school performance • Trajectories provide evidence for expected growth as well as likely obtainment (e.g. CAHSEE results)
If you choose to use this end slide, simply delete the previous slide (with no contact information). Pete Goldschmidt voice email 818.677.4601 pete.goldschmidt@csun.edu next presentation