Download
1 / 12
120 likes | 239 Vues
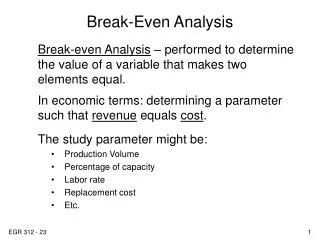
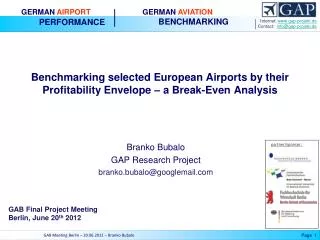
Benchmarking selected European Airports by their Profitability Envelope – a Break-Even Analysis. Branko Bubalo GAP Research Project branko.bubalo @ googlemail.com. GAB Final Project Meeting Berlin, June 20 th 2012. Contents. Introduction Theoretical Background and Data description

E N D
Benchmarking selected European Airports by their Profitability Envelope – a Break-Even Analysis Branko Bubalo GAP Research Project branko.bubalo@googlemail.com GAB Final Project Meeting Berlin,June 20th2012 GAB Meeting Berlin – 20.06.2012 – Branko Bubalo
Contents • Introduction • Theoretical Background and Data description • Application of the maximum profitability envelope • Break-Even analysis • Conclusions and Outlook GAB Meeting Berlin – 20.06.2012 – Branko Bubalo
Introduction • Results from benchmarking study on Norwegian airports • Extension and upgrade of GAP Database • Limited perspective on Profits (EBIT) and ratio ‘unit profits’ (EBIT per PAX) as one of the main chosen Partial Factor Productivity (PFP) indicators. -> Intuition that this measure could be relevant and important, fuelled by pre-report of Ministry of Transportation in Norway (St.meld. nr. 48 [‘Report 48’]). • There exist certain alternatives, such as ‘EBITDA per WLU’ (Earnings before Interests, Taxes and Depreciation/Amortization per Workload Unit). GAB Meeting Berlin – 20.06.2012 – Branko Bubalo
Data: Total Costs and Revenues (log scale) and EBIT • Trends for 210 European airports over 9 years (2002 to 2010*) • *except for Italy & • France until 2009 Break-Even Points (Source: Own illustration) GAB Meeting Berlin – 20.06.2012 – Branko Bubalo
Animation of Ebit and Ebit per PAX over time in Norway • Critical Mass to make profits lies around 2 million PAX • Lower end of Airports has sharply increasing Losses per PAX (Source: Own illustration) GAB Meeting Berlin – 20.06.2012 – Branko Bubalo
Data points relative to the frontier and break-even line • “Keep it simple” approach: (Source: Own illustration) GAB Meeting Berlin – 20.06.2012 – Branko Bubalo
Algorithm: • i= 1 to n # n = Number of airports in the sample. • PAXi < PAXi+1 < … < PAXn # Sort PAX column in ascending order. • Envelopei= EBIT per PAXi # Initialize with first data point in ‘EBIT • # per PAX’; i = 1. • For i to n ≥ 2, # From the second entry onwards, the • Envelopei+1 = # new entry is compared, if larger than • # last Benchmark. If yes, it is set as new #‘EBIT per PAX’ Benchmark (Envelope). • Loop: • If EBIT per PAXi+1 > Envelopei • Then EBIT per PAXi+1 • Else Envelopei (Source: Own illustration) GAB Meeting Berlin – 20.06.2012 – Branko Bubalo
Application of the Profitability Envelope on the dataset Break-Even Point (Source: Own illustration) GAB Meeting Berlin – 20.06.2012 – Branko Bubalo
Profitability Envelope by year (even years 2002-2010) (Source: Own illustration) GAB Meeting Berlin – 20.06.2012 – Branko Bubalo
Break Even analysis • Cumulative EBIT and EBIT incl. efficiency gains for 140 Euro airports • Shift of Break-Even Point Efficiency Gain Shift of Break-Even point (Source: Own illustration) GAB Meeting Berlin – 20.06.2012 – Branko Bubalo
Conclusions • Maximum profitability envelope gives benchmarks relative to airport size without the need of arbitrary classifications. • Feasible Efficiency gains, by adjusting to best practices, are substantial. • Scenarios towards changes in Revenue/Cost structure can be quantified, e.g. in a cost-benefit analysis (CBA) regarding changes in Airport Charges scheme. GAB Meeting Berlin – 20.06.2012 – Branko Bubalo
Thank you for your attention! Questions? Suggestions and Comments are welcome. branko.bubalo@googlemail.com www.gap-projekt.de GAB Meeting Berlin – 20.06.2012 – Branko Bubalo