Break-Even Analysis
Break-Even Analysis. Break-even Analysis – performed to determine the value of a variable that makes two elements equal. In economic terms: determining a parameter such that revenue equals cost . The study parameter might be: Production Volume Percentage of capacity Labor rate


Break-Even Analysis
E N D
Presentation Transcript
Break-Even Analysis Break-even Analysis – performed to determine the value of a variable that makes two elements equal. In economic terms: determining a parameter such that revenue equals cost. The study parameter might be: • Production Volume • Percentage of capacity • Labor rate • Replacement cost • Etc.
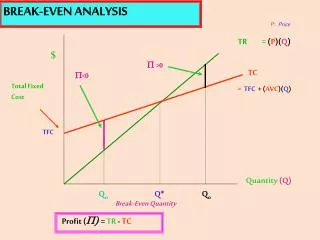
Break-Even Analysis Cost Function: Fixed Cost (FC) – that cost which does not vary based on production volume. Includes building, insurance, fixed overhead (e.g. Engineering staff), equipment recovery cost, information systems, etc. Variable Cost (VC) – that cost which varies as production volume varies. Includes direct labor, materials, warranty, utilities (power consumption), marketing, etc.
Break-Even Analysis Cost Function – cont.: Total Cost = Fixed Cost + Variable Cost Cost presented as a function of production volume.
Break-Even Analysis Breakeven Point What is the breakeven point in terms of Production volume?
Break-Even Analysis Breakeven Point –cont. FC = $10,000 VC = $5000(per 1000 units) Revenue = $8000(per 1000 units) Let Q = Production Volume (000s) QBE = Production Volume (000s) at the Breakeven point Total Cost = Revenue FC + VC*QBE = Revenue *QBE QBE = ________________
Break-Even Analysis Sensitivity Analysis Impact of reducing or increasing one factor while holding the other constant. Example: What is the QBE if VC varies from $4000 to $6000?
Break-Even Analysis In-Class Exercise You are an entrepreneur planning to enter the gourmet organic burger market. Your marketing consultant believes you can sell 150,000 burgers at $1.99 each. Fixed costs for the business are expected to total $140,000. In addition, variable costs will total about 0.97 per burger. How many burgers must you sell to break even? What if the price is $2.79? How many must you sell to break even?
Break-Even Analysis In-Class Exercise
Break-Even Analysis Breakeven analysis between two alternatives: If demand for the product is 1,000 units a month, which alternative should you choose? 3,000 units a month?
Break-Even Analysis Breakeven analysis between two alternatives: What is the breakeven point? FC1 = $10,000 FC2 = $15,000 VC1= $5000 / (000s units) VC2= $2000 / (000s units) FC1 + VC1*QBE = FC2 + VC2*QBE _________________________ QBE = ____________
Break-Even Analysis AW approach: Two alternatives exist for a machining process. Alternative 1 has an initial cost of $10,000 and a salvage value of $1000 after 5 years. Alternative 1 also has a variable cost of $1/unit of product produced and an annual maintenance of $1000. Alternative 2 has an initial cost of $15,000 and a salvage value of $2,000 after 7 years. Alternative 2 also has a variable cost of $0.80/unit of product produced and an annual maintenance cost of $1200. What is the breakeven point in annual production volume? Assume a MARR of 10%.
Break-Even Analysis AW approach: Let x = annual production volume. AW1 = -$10,000 (A/P, 10%,5) + $1000(A/F,10%,5) - $1000 – 1.0x AW1 = _______________________________________ AW1 = _______________________ AW2 = -$15,000 (A/P, 10%,7) + $2000(A/F,10%,7) - $1200 – .8x AW2 = _________________________________________ AW2 = ________________________ x = ______