Break-Even Analysis
Break-Even Analysis. Terminology. Sales Revenue / Income – The amount of money a company takes from selling goods or services. Quantity sold x Sale price of each item Costs / Expenditure – The money that businesses spends while they trade. There are fixed, variable and total costs


Break-Even Analysis
E N D
Presentation Transcript
Terminology • Sales Revenue / Income – The amount of money a company takes from selling goods or services. • Quantity sold x Sale price of each item • Costs / Expenditure – The money that businesses spends while they trade. • There are fixed, variable and total costs • Profit (or loss). The amount of money a business makes (or loses) from carrying out their trade. • Sales Revenue – Total Costs.
Income £50,000 Costs £40,000 Profit £10,000 Income £50,000 Costs £60,000 Loss £10,000 The basics of break-even analysis 1 • Businesses must make a profit to survive • To make a profit, income must be higher than expenditure (or costs)
The basics of break-even analysis 2 There are two types of costs: • Variable costs increase by a step every time an extra product is sold (eg cost of ice cream cornets in ice cream shop) • Fixed costs have to be paid even if no products are sold (eg rent of ice cream shop)
Examples of costs • Variable: materials, labour, energy • Fixed: rent, business rates, interest on loans, insurance, staff costs (e.g. security) These vary, depending upon the type of business. Typical costs include:
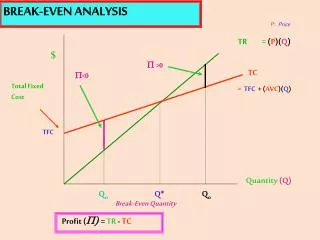
The break-Even Point • Variable costs + fixed costs = total costs • When total costs = sales revenue, • This is called the break-even point, • eg • total costs = £5,000 • total sales revenue = £5,000 • At this point the business isn’t making a profit or a loss – it is simply breaking even.
Why calculate break-even? Tom can hire an ice-cream van for an afternoon at a summer fete. The van hire will be £100 and the cost of cornets, ice cream etc will 50p per ice cream. Tom thinks a sensible selling price will be £1.50. At this price, how many ice-creams must he sell to cover his costs? Calculating this will help Tom to decide if the idea is worthwhile.
Identifying the break-even point Profit Loss Break-even point
Fixed costs (Selling price per unit minus variable cost per unit) Using a formula to calculate the break-even point The break-even point = Also known as the Contribution as the amount left is what contributes to paying off the fixed costs.
Fixed costs (Selling price per unit minus variable cost per unit) Tom:£100 (£1.50 – £0.50) Applying the formula = 100 Contribution is £1.00 per unit
Why the Break Even point may change • Changes in the break even point may happen if: • Fixed Costs change • Variable Costs change, or • The selling price changes.
Increase in fixed costs. Original B.E.P = 100 If fixed costs go up to £120. The B.E.P= 120 £120 . (1.50-.50) The reverse happens if fixed costs fall.
Increase in variable costs. Original B.E.P = 100 If variable costs go up to £0.60 The B.E.P= 112 £100 . (1.50-.60) The reverse happens if variable cost falls.
Increase in Selling price. Original B.E.P = 100 If selling price goes up to £1.60 The B.E.P= 91 £100 . (1.60-.50) The reverse happens if selling price falls.
Margin of Safety • If a business knows a level at which it would like to sell / produce at it can work out its Margin of Safety. • The Margin of Safety is the different between the BEP and the actual level of production / sales. • E.g. If Tom aimed to sell 200 ice creams he would have a Margin of Safety of 100 as his BEP is 100 ice creams.
Margin of Safety Margin of Safety – On the BE Graph. Profit Break-even point Loss
Target Profits • A business can use the break even formula to calculate the quantity needed in order to achieve a target profit. • Target profit (the profit a business wants to make) is calculated as follows: • Fixed Costs + Target Profit = Number of units • Contribution per unit
Benefits of Break Even Analysis • Graph easier to understand. • Helps in the decision making process. • Shows level of profit / Costs at different output / sales levels. • Can establish margin of safety.
Drawbacks of Break Even Analysis • Can only be used in the short term. All costs potential change. • If batch processing used cannot obtain exact BEP. • Model only viable for one type of product / service at a set price. • Assumption all output sold. Not always the case.
Contribution / Marginal Costing • Once the contribution per unit has been calculated you can also calculate the total contribution at various levels of output or sales. Total Contribution = Contribution per unit x Total Number of sales / output. E.g. £1 x 200 ice creams = £200 total contribution
Contribution / Marginal Costing • Once the total contribution and fixed costs are know you can work out the price at a particular output / sales level. • Profit = Total Contribution - Fixed Costs • If 200 ice creams sold, profit would be: • £200 - £100 • = £100 profit