BREAK EVEN ANALYSIS
BREAK EVEN ANALYSIS. Key Terminology. COSTS. The money that firms spend to make their products, or to run their business. Y-AXIS. The vertical axis on a chart/graph. REVENUE. The money firms get from providing a service, or selling products. CONTRIBUTION METHOD.


BREAK EVEN ANALYSIS
E N D
Presentation Transcript
BREAK EVEN ANALYSIS Key Terminology
COSTS The money that firms spend to make their products, or to run their business.
Y-AXIS The vertical axis on a chart/graph.
REVENUE The money firms get from providing a service, or selling products.
CONTRIBUTION METHOD Working out the break even point by using a sum.
GROSS SALES The amount of money made from services, or products, without deducting operating expenses, the cost of the goods sold, payment of taxes, etc.
FIXED COSTS Expenses that do not vary with output, or sales. [Give 3 examples for a bonus point]
LOSS The difference between total revenue and total cost, where costs are higher than revenues.
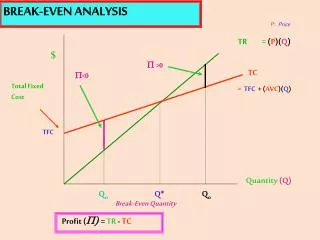
BREAK EVEN To exactly cover the total costs by sales.
TOTAL COSTS Fixed Costs + Variable Costs
X-AXIS The horizontal axis on a chart/graph.
SALES Products or services which have been exchanged for money.
BREAK EVEN CHART A line graph that is used to work out when an organisation will stop making a loss and begin making a profit.
PROFIT The difference between total revenue and total cost, where revenues are higher than costs.
NET SALES The amount of money made from services or products after deductions such as returned goods, discounts, or damaged goods.
TOTAL REVENUE Price Per Unit x Net Sales
VARIABLE COSTS Expenses that change with the quantity produced/used. [Give 3 examples for a bonus point]