Break-even Analysis
Break-even Analysis. Fixed Costs. Fixed Costs – Fixed costs are any costs which do not vary directly with the level of output. These costs are linked to time rather than to level of business activity. Fixed costs exist even if a business is not producing any goods or services.


Break-even Analysis
E N D
Presentation Transcript
Fixed Costs • Fixed Costs – Fixed costs are any costs which do not vary directly with the level of output. These costs are linked to time rather than to level of business activity. Fixed costs exist even if a business is not producing any goods or services. • Rent, Rates, Insurance, Loan repaid capital, Loan repaid insurance, Advertising & Promotion, Drawings • Do not include start-up costs such as Equipment, vehicle. • Need to consider wages, they might be variable.
Fixed Costs Cost Output
Variable Costs • Variable costs are those costs that vary directly with the level of output. They represent payments made for the use of inputs such as piece-rate labour, fuel and raw materials. If the manufacturer doubled output then these costs would double. • Wages, Postage, VAT, Opening stock, trade purchases, energy, petrol, maintenance, stationary
Variable Costs Cost Output
Total Costs = FC +VC C B A Cost Output
Total Costs Variable Costs Fixed Costs Cost Output
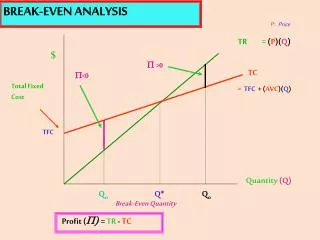
Break-even Analysis • Break-even analysis compares a firm’s revenue with its fixed and variable costs to identify the minimum level of sales needed to cover costs. This can be shown on a graph known as a break-even chart.
Calculating break-even Requires (Work these out first and write down): • Selling price of product (use average price to make it easier) • Fixed Costs figure • Variable cost per unit (Monthly variable costs/demand) Break-even = Fixed Costs Contribution
Step 1 - Contribution Contribution = Selling Price – Variable Cost Per Unit So, now you know your Fixed Costs and Contribution Fixed Costs/ Contribution
My Thai Example • Average price spent is £20 • Variable cost per unit is £8 • Fixed Costs of the business are £9000 • What is the Breakeven Point?
My Thai Example • Average price spent is £20 • Variable cost per unit is £8 • Fixed Costs of the business are £9000 • Contribution = 20 – 8 = £12 • 9000 = 750 customers (or units) 12