
Understanding Break-Even Analysis: Profit Contribution and Critical Quantity Calculation
Break-even analysis is a crucial financial tool that helps businesses determine the point at which total revenues equal total costs. This analysis involves calculating the break-even quantity (Q*) necessary to cover total fixed costs (TFC) and average variable costs (AVC). With a clear understanding of the price (P) and how profit contribution impacts overall profitability, businesses can strategically plan pricing and production. By assessing these factors, organizations can optimize resource allocation and improve financial decision-making.

Understanding Break-Even Analysis: Profit Contribution and Critical Quantity Calculation
E N D
Presentation Transcript
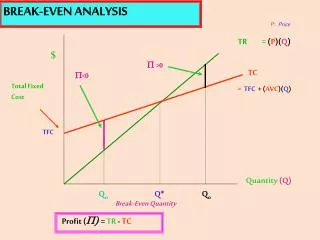
BREAK-EVEN ANALYSIS BREAK-EVEN ANALYSIS P:Price TR = (P)(Q) $ P >0 TC P<0 Total Fixed Cost =TFC + (AVC)(Q) TFC Quantity (Q) Qo Q* Qo Break-Even Quantity Profit (P)= TR - TC
P:Price TFC:Total Fixed Cost Example: TFC TFC = $10.000 P = $20 Q* = AVC = $15/unit (P - AVC) 10.000 Q* = = 2.000 units (20 - 15) BREAK-EVEN ANALYSIS Profit (P)= TR - TC Critical Quantity: P = 0 TR = TC PQ* = TFC + (AVC)Q* PQ* - (AVC)Q* = TF (P - AVC)Q* = TFC P - AVC: gross margin
SPC 2,000 S* = = $8.000/wk S* = [(P-AVC)/P] [(20 - 15)/20] PROFIT-CONTRIBUTION & BREAK-EVEN Profit Volume = PV= (P)Q - (AVC)Q = (P – AVC)Q Sales = S = (P)Q Q = S/P PV = [(P – AVC)]S P Profit Contribution = Profit Volume – Specific ProgramCosts Pc = PV– SPC • Suppose P = $20/kg AVC = $15/kg SPC = $2,000 • Then: • PC = [(P-AVC)/P] S – SPC • = [(20 – 15)/20]S – 2,000 • = [.25]S – 2,000
PROFIT-CONTRIBUTION & BREAK-EVEN =[.25]14,000 – 2,000 = $1,500 PC 1,500 S* Profit Contribution ($) 0 14,000 8,000 Sales Volume/week ($) -2,000 PC = [.25]S – 2,000 S* = [2.000]/.25 = $8,000
PROFIT-CONTRIBUTION & BREAK-EVEN =[.33]14,000 – 2,000 = $2,620 PC’ 2,620 PC 1,500 S*’ S* Profit Contribution ($) 0 8,000 14.000 14,000 Sales Volume/week ($) -2,000 PC = [.33]S – 2,000 S*’ = [2,000]/.33 = $6,061


