Quasi-Experimental Designs ♣
150 likes | 311 Vues
Explore nonrandom assignment designs & threats to validity. Learn to identify, counter threats & infer causality effectively.

Quasi-Experimental Designs ♣
E N D
Presentation Transcript
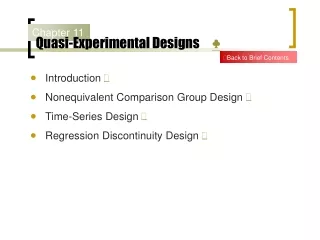
Quasi-Experimental Designs ♣ Chapter 11 Back to Brief Contents • Introduction • Nonequivalent Comparison Group Design • Time-Series Design • Regression Discontinuity Design
11.0 Introduction Back to Chapter Contents • Quasi-experimental design • Not meet all the requirements necessary for controlling the influence of EV • (e.g.) random assignment • Not eliminate all threats to internal validity • Threats to internal validity are ruled out byTab 11.1 • Identification and study of the threats • By including design elements as pretests or other control groups • By coherent pattern matching—making a complex prediction that few rival hypotheses can explain
11.1 Nonequivalent Comparison Group Design Back to Chapter Contents pre-test treatment posttest Exper. Gp Y1 X Y2 Control Gp Y1 Y2 Fig 11.1 • This is the most common quasi-experimental design • Threats frequently reveal themselves in the outcome • Example Fig 11.211.3 • Possible biases Tab 11.2
11.1 Nonequivalent Comparison Group Design Back to Chapter Contents • Outcomes with Rival Hypotheses • Outcome I: First Increasing Treatment Effect • Outcome II: Increasing Treatment and Control Groups • Outcome III: Second Increasing Treatment Effect • Outcome IV: Crossover Effect • Causal Inference from the Nonequivalent Comparison Group Design
Outcome Patterns in the Nonequivalent Comparison Group Design • I: Increasing treatment effect Fig 11.4 experimental control pretest posttest • Threat: Selection-Maturation, Selection-History • Eliminate Selection-Maturation:MatchingTab 11.3 Statistical Regression Techniques
II: Increasing treatment and control groupsFig 11.5 experimental control pretest posttest • Selection-maturation is a threat
III: Increasing treatment effect Fig 11.6 • Statistical regression is a threat • Selection-history is a threat control experimental pretest posttest
IV: Cross-over effect Fig 11.7 • No possible rival hypotheses (history?) experimental control pretest posttest
11.1 Nonequivalent Comparison Group Design Back to Chapter Contents • Outcomes with Rival Hypotheses • Causal Inference from the Nonequivalent Comparison Group Design • Well designed and executed: ≈ randomized design • Well designed • P assigned to group: not self-select • Reduce pretest difference: matching
11.2 Time-Series Design Back to Chapter Contents • Interrupted Time-Series design Fig 11.8 Pre-response Treatment Post-response Y1 Y1 Y1 Y1 X Y2 Y2 Y2 Y2 • Treatment effect revealed by a different pattern of pre and posttest responses
11.2 Time-Series Design Back to Chapter Contents • Interrupted Time-Series design • Lawler & Hackman (1969) • IV: employee participation in develop and implementation of incentive plan • DV: absenteeism Fig 11.9 • Vernon, Bedford, & Wyatt (1924) • IV: introduce a rest period • DV: productivity (output) Fig 11.11 • One-group pretest-posttest Fig 11.10
11.2 Time-Series Design Back to Chapter Contents • Interrupted Time-Series design • Possible patterns Fig 11.12 • Statistical method • Bayesian moving average model • Tryon (1982), Crosbie (1993) • Threat: History (end)
11.3 Regression Discontinuity Design Back to Chapter Contents • Used to determine if the special treatment some individuals receive has any effect • Characteristics of the designFig 11.13 • All individuals are pretested • Individuals who score above some cutoff score receive the treatment • All individuals are posttested • Discontinuity in the regression line indicates a treatment effect Fig 11.1411.15
11.3 Regression Discontinuity Design Back to Chapter Contents • Design Criteria that Must be Adhered toTab 11.4 • Assignment must be based on the cutoff score • Assignment cannot be a nominal variable as gender, or drug user or nonuser • Cutoff score should be at (or near) the mean • Experimenter should control group assignment • Relationship (linear, curvilinear, etc.) should be known • Participants must be from the same population
11.3 Regression Discontinuity Design Back to Chapter Contents • Primary Threat in the Regression Discontinuity Design • Contemporaneous history effect — This is possible but not plausible • Attrition: any design • This is the more powerful of the quasi-experimental designs (end)