Population Genetics
Population Genetics. It is the study of the properties of genes in populations. The Hardy–Weinberg Principle G. H. Hardy, an English mathematician, and G. Weinberg, a German physician.


Population Genetics
E N D
Presentation Transcript
Population Genetics It is the study of the properties of genes in populations
The Hardy–Weinberg Principle • G. H. Hardy, an English mathematician, and G. Weinberg, a German physician. • They pointed out that the original proportions of the genotypes in a population will remain constant from generation to generation, as long as the following assumptions are met: • The population size is very large. • Random mating is occurring. • No mutation takes place. • No genes are input from other sources (no immigration takes place). • No selection occurs.
Dominant alleles do not replace recessive ones. • Because their proportions do not change, the genotypes are said to be in Hardy–Weinberg equilibrium. • In algebraic terms, the Hardy–Weinberg principle is written as an equation. • In statistics, frequency is defined as the proportion of individuals falling within a certain category in relation to the total number of individuals under consideration. • Based on these phenotypic frequencies, can we deduce the underlying frequency of genotypes?
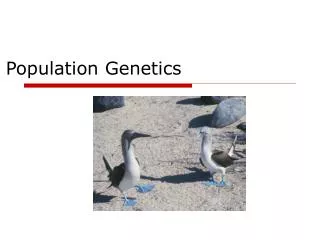
Environment Affects Gene Frequency • Darker skin protects against UV light
Hardy-Weinberg Equations • Let the letter p designate the frequency of one allele and the letter q the frequency of the alternative allele. • Because there are only two alleles, p plus q must always equal 1. • The Hardy-Weinberg equation can now be expressed in the form of what is known as a binomial expansion:
p + q = 1 • Frequency of dominant alleles plus frequency all recessive alleles is 100% ( or 1) • p2 + 2pq + q2 = 1 • AA plus 2Aa plus aa add up to 100% (or 1) • Applies to populations that are not changing • They are in equilibrium
Important • Need to remember the following: p2 = homozygous dominant 2pq = heterozygous q2 = homozygous recessive
Consider a population of 100 cats, with 84 black and 16 white cats. • In this case, the respective frequencies would be 0.84 (or 84%) and 0.16 (or 16%). • Based on these phenotypic frequencies, can we deduce the underlying frequency of genotypes?
If q2 = 0.16 (the frequency of white cats), then q = 0.4. • Therefore, p, the frequency of allele B, would be: 0.6 (1.0 –0.4 = 0.6). • We can now easily calculate the genotype frequencies: there are p2 = (0.6)2 x 100 (the number of cats in the total population), or 36 homozygous dominant BB individuals. • The heterozygous individuals have the Bb genotype, and there would be 2pq, or (2 x 0.6 x 0.4) x 100, or 48 heterozygous Bb individuals.
Phenotypically, if the population size remains at 100 cats, we will still see approximately 84 black individuals (with either BB or Bb genotypes) and 16 white individuals (with the bb genotype) in the population. • Allele, genotype, and phenotype frequencies have remained unchanged from one generation to the next.
Consider the recessive allele responsible for the serious human disease cystic fibrosis. • This allele is present in North Americans of Caucasian descent at a frequency q of about 22 per 1000 individuals, or 0.022. • What proportion of North American Caucasians, therefore, is expected to express this trait?
The frequency of double recessive individuals (q2) is expected to be 0.022 x 0.022, or 1 in every 2000 individuals. • If the frequency of the recessive allele q is 0.022, then the frequency of the dominant allele p must be 1 – 0.022, or 0.978. • The frequency of heterozygous individuals (2pq) is thus expected to be 2 x 0.978 x 0.022, or 43 in every 1000 individuals. • How valid are these calculated predictions? • For some genes the calculated predictions do not match the actual values.
Do Allele Frequencies Change? • According to the Hardy–Weinberg principle, both the allele and genotype frequencies in a large, random-mating population will remain constant from generation to generation. • Individual allele frequencies often change in natural populations, with some alleles becoming more common and others decreasing in frequency. • The Hardy–Weinberg principle establishes a convenient baseline against which to measure such changes. • By looking at how various factors alter the proportions of homozygotes and heterozygotes, we can identify the forces affecting particular situations we observe.
What factors can alter allele frequencies? • Mutation • Gene flow (including both immigration into and emigration out of a given population). • Nonrandom mating, • Genetic drift (random change in allele frequencies, which is more likely in small populations). • Selection. • Only selection produces adaptive evolutionary change because only in selection does the result depend on the nature of the environment. • The other factors operate relatively independently of the environment, so the changes they produce are not shaped by environmental demands.
Five agents of evolutionary change • Mutation • Mutation from one allele to another can obviously change the proportions of particular alleles in a population. • Mutation rates are generally so low that they have little effect on the Hardy–Weinberg proportions of common alleles. • A single gene may mutate about 1 to 10 times per 100,000 cell divisions (although some genes mutate much more frequently than that).
2. Gene Flow • Gene flow is the movement of alleles from one population to another. • It can be a powerful agent of change because members of two different populations may exchange genetic material. • Sometimes gene flow is obvious, as when an animal moves from one place to another. • Other important kinds of gene flow are not as obvious. • These subtler movements include the drifting of gametes or immature stages of plants or marine animals from one place to another.
3. Nonrandom Mating • Individuals with certain genotypes sometimes mate with one another more commonly than would be expected on a random basis, a phenomenon known as nonrandom mating. • Inbreeding (mating with relatives) is a type of nonrandom mating that causes the frequencies of particular genotypes to differ greatly from those predicted by the Hardy–Weinberg principle. • By increasing homozygosity in a population, inbreeding increases the expression of recessive alleles.
4. Genetic Drift • In small populations, frequencies of particular alleles may change drastically by chance alone. • Such changes in allele frequencies occur randomly, as if the frequencies were drifting, and are thus known as genetic drift. • For this reason, a population must be large to be in Hardy–Weinberg equilibrium. • A set of small populations that are isolated from one another may come to differ strongly as a result of genetic drift even if the forces of natural selection do not differ between the populations.
Two related causes of decreases in a population’s size are founder effects and bottlenecks. • a. Founder Effects. • Sometimes one or a few individuals disperse and become the founders of a new, isolated population at some distance from their place of origin. • These pioneers are not likely to have all the alleles present in the source population. • In some cases, previously rare alleles in the source population may be a significant fraction of the new population’s genetic endowment. • This phenomenon is called the founder effect. Founder effects are not rare in nature.
b. The Bottleneck Effect. • Even if organisms do not move from place to place, occasionally their populations may be drastically reduced in size. • The few surviving individuals may constitute a random genetic sample of the original population (unless some individuals survive specifically because of their genetic makeup). • The resultant alterations and loss of genetic variability has been termed the bottleneck effect. • Some living species appear to be severely depleted genetically and have probably suffered from a bottleneck effect in the past.
5. Selection • As Darwin pointed out, some individuals leave behind more progeny than others, and the rate at which they do so is affected by phenotype and behavior. • We describe the results of this process as selection and speak of both artificial selection and natural selection. • In artificial selection, the breeder selects for the desired characteristics. • In natural selection, environmental conditions determine which individuals in a population produce the most offspring.
For natural selection to occur and result in evolutionary change, three conditions must be met: • Variation must exist among individuals in a population. • Variation among individuals results in differences in number of offspring surviving in the next generation. • Variation must be genetically inherited.
For natural selection to result in evolutionary change, the selected differences must have a genetic basis. • It is important to remember that natural selection and evolution are not the same—the two concepts often are incorrectly equated. • Natural selection is a process, whereas evolution is the historical record of change through time. • Evolution is an outcome, not a process. • Natural selection (the process) can lead to evolution (the outcome), but natural selection is only one of several processes that can produce evolutionary change. • Moreover, natural selection can occur without producing evolutionary change; only if variation is genetically based will natural selection lead to evolution.
Gene Flow versus Natural Selection • Gene flow can be either a constructive or a constraining force. • On one hand, gene flow can increase the adaptedness of a species by spreading a beneficial mutation that arises in one population to other populations within a species. • On the other hand, gene flow can act to impede adaptation within a population by continually importing inferior alleles from other populations.
Question: • Iguanas with webbed feet (recessive trait) make up 4% of the population. What in the population is heterozygous and homozygousdominant.
q2 = 0.04 2. then use 1 = p + q 3. for heterozygous use 2pq 4. For homozygous dominant use p2 Answer: 1. q2 = 4% or 0.04 q = 0.2 1 = p + 0.2 1 - 0.2 = p 0.8 = p 2(0.8)(0.2) = 0.32 or 32% 0.82 = 0.64 or 64%
Normal fingers dominate = D • Short middle finger recessive = d • DD = (p2) = normal • Dd = (2pq) = normal • dd = (q2) = short middle finger • If 70% of the alleles in a gene pool are D then what percent of alleles are d?
First Equation • p + q = 1 • p is the frequency of the dominant allele, D • q is the frequency of the recessive allele d • 0.7 + q = 1 • q = 1 - 0.7 • q = 0.3
Second Equation • p2 + 2pq + q2 = 1 • p2 = DD • 0.7 x 0.7 = 0.49 • 2pq = Dd • 2 x 0.7 x 0.3 = 0.42 • q2 = dd • 0.3 x 0.3 = 0.9 • 0.49 + 0.42 + 0.9 = 1
Allele Frequency • DD with normal fingers = 49% of population • Dd with normal fingers = 42% of population • dd with short middle finger = 9% of population
Cystic fibrosis affects 1 in 2000 white Americans • Cystic fibrosis is recessive = cc • 1 in 2000 = 1/2000 = .0005 • q2 = .0005 • What is q?
Value of q • q is the square root of q2 • q2 = .0005 • Square root of .0005 = .022 • What is p?
Value of p • p + q = 1 • Since q = .022 • Then p = .978 (1-.022) • What are the values for p2 and 2pq?
Values for p2 and 2pq • P2 = pxp =.978 x .978 = .956 • 2pq = 2 x .978 x . 022 = .043 • 4.3% of population are carriers for cystic fibrosis
Problem • Mark and Carol are expecting a baby. What is the chance the baby will have cystic fibrosis?
Solution • The chance of Mark being a carrier is 0.043 • The chance of Carol being a carrier is 0.043 • The change of two carriers producing a child with a a recessive trait is 0.25 • 0.043 x 0.043 x 0.25 =0.00046 @ 1/2000
Practical Application of Hardy-Weinberg Equations • If you know the frequency of the recessive phenotype (aa) you can calculate the percent of the population that are carriers (Aa) and that are AA.
Problem • Assume 16% of the a given population has a continuous hairline as opposed to the dominant phenotype of a widow’s peak. • Determine the percent of the population with the following • A. Homozygous for widow’s peak • B. Heterozygous for widow’s peak • C. Homozygous for continuous hair line
Solution • ww = 16% = 0.16 • Given in the problem • ww = q2 • w = q = sq. root of q2 = sq. root of 0.16 = 0.4 • Solve for p using equation p + q = 1 • 1 - 0.4 = 0.6 • p2 = p x p = 0.6 x 0.6 = 0.36 • Heterozygotes = 2pq =2 x 0.6 x 0.4 = 0.48
Solution Continued • WW widow’s peak = 36% • Ww widow’s peak = 48% • ww continuous hair line = 16%
Problem Maple syrup urine disease (MSUD) is an autosomal recessive disease that causes mental and physical retardation and a sweet smelling urine. In Costa Rica, 1 in 8000 newborns inherit this condition. Calculate the carrier frequency of MSUD.
Answer • q2 (mm) = 1/8000 = 0.000125 • q (m) = sq. root of 0.000125 = 0.011 • p = 1 - 0.011 = 0.989 • Carrier frequency = 2pq = 2 x 0.011 x 0.989 = 0.022 or 2.2/100
The End The End
DNA Fingerprint • RFLPs are not the same in everyone • Pattern of RFLPs forms the DNA fingerprint
DNA fragments separated by electrophoresis • DNA placed in wells on a gel slab • DNA is attracted by the + charge at the end of the gel. • Gel acts like a screen to inhibit movement of DNA fragments • Smaller fragments move faster
DNA Fragments • Well 4 (on right) has the smallest DNA fragment • It moved the most • Well 3 has the largest DNA fragment • It moved the least
Crime Scene • A blood stain was discovered at a crime scene • Which of the 7 suspects has the same DNA fingerprint as the bloodstain?
Perfect Match • Suspect 3 has the same DNA fingerprint