The Gini Index
The Gini Index. Paige Stillwell and Tanya Picinich. Overview . Lorenz Curve Perfect Income Equality / Complete Income Inequality Gini Index Calculation Examples United States Gini Index Riemann Sum and Trapezoidal Rule Potential Issues with the Gini Index


The Gini Index
E N D
Presentation Transcript
The Gini Index Paige Stillwell and Tanya Picinich
Overview • Lorenz Curve • Perfect Income Equality / Complete Income Inequality • Gini Index • Calculation Examples • United States Gini Index • Riemann Sum and Trapezoidal Rule • Potential Issues with the Gini Index • Why is the Gini Index Important? • Gini Index Comparison Across Countries • United States Gini Index Over Time
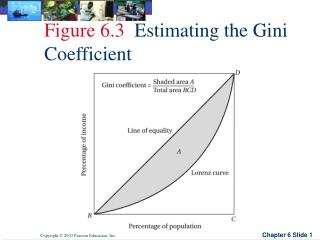
The Lorenz Curve • Shows the share of total income of the population from 0 to t where t is the rank of a household’s income as a percentage of the total population
20% of the population makes 20% of the income and so on Lorenz curve has the equation y=x Perfect Income Equality: Utopia
Complete Inequality • One person makes all the money. Everyone else makes nothing
Gini Index • Gives information about the income inequality of a country in one number • Ranges from 0 to 1 • Calculated as the area between perfect equality (y=x) and the Lorenz curve
The Gini Index for perfect equality is 0 • The Gini Index for total inequality is 1
Example: L(t) = t2 • What’s the Gini Index for a country that has a Lorenz curve of L(t) = t2 ?
Example: L(t) = t3 • Will the Gini Index increase or decrease from the previous example if the equation changes to L(t) = t3?
Reality: How the Gini Index is Calculated • In real life we are not given functions • We must use data points to find the Gini Index • We use income quintiles which are made available by the U.S. Census Bureau
The United States Gini Index 2007 • The United States Gini Index for 2007 is quoted by the U.S. Census Bureau as G(t)=.463 • This value may vary depending on what is considered as income and whether individuals or households are examined
Riemann Sum and Trapezoidal Rule • Approximates an integral when the equation of the function is unknown • Using the 2007 data we can approximate the Gini Index • Riemann sums use either right or left endpoints to form rectangles • The trapezoidal rule is the average of the right and left endpoint approximations
Riemann Sum • The definition of an integral of f from a to b is: • Using right end points: • Using left end points:
Riemann Sum • Using right end points: • Using left end points:
Trapezoidal Rule • Basically an average of the right and left endpoints from the Riemann Sum • Using the 2007 Income Quintiles as data points we get:
Trapezoidal Rule Actual Gini Index = .463
Potential Issues • The Gini Index glosses over many details • Gives a more accurate picture of the relationship between the upper class and middle class than the relationship between the upper class and lower class • Does not reflect unreported income and money received through welfare systems
Jackknife Calculate the Gini Index many times, but remove one data point each time Produces a mean distribution and a standard deviation for the Gini Index Bootstrap Calculate the Gini Index from a random sample of the income data many times Produces a mean distribution and a standard deviation for the Gini Index Ways to calculate a more accurate Gini Index:
Why is the Gini Index so important? • Compiles information about income inequality into 1 number • Allows for comparisons with other countries • Shows how income inequality changes over time • This information has great social, political, and economic implications
Comparisons Across Countries • The Gini index for the entire world = 56 - 66 • Tolerance for inequality of income varies between countries • US = higher tolerance for income inequality • European countries = lower tolerance for income inequality • Underdeveloped countries have a higher income inequality