Download
1 / 17
190 likes | 695 Vues
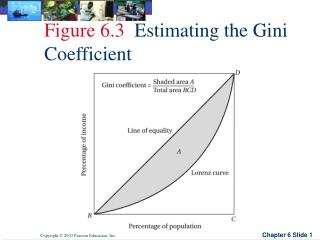
Figure 6.3 Estimating the Gini Coefficient. Figure 6.4 Four Possible Lorenz Curves. Figure 6.7 Improved Income Distribution under the Traditional-Sector Enrichment Growth Typology. Figure 6.8 Worsened Income Distribution under the Modern-Sector Enrichment Growth Typology.

E N D
Figure 6.7 Improved Income Distribution under the Traditional-Sector Enrichment Growth Typology
Figure 6.8 Worsened Income Distribution under the Modern-Sector Enrichment Growth Typology
Figure 6.9 Crossing Lorenz Curves in the Modern-Sector Enlargement Growth Typology
Figure 6.11 Kuznets Curve with Latin American Countries Identified
Figure 6.13 Comparison of Gross National Product Growth Rates and Income Growth Rates of the Bottom 40% of the Population in Selected Less Developed Countries
Figure 6.16 Poverty in the Developing World Is Shifting toward South Asia and Sub-Saharan Africa
Absolute poverty Asset ownership Character of economic growth Deciles Disposable income Elasticity of factor substitution Factor-price distortions Factor share distribution of income Factors of production Foster-Greer-Thorbecke (FGT) index Functional distribution of income Concepts for Review
Gini coefficient Headcount index Human Poverty Index Income inequality Indirect taxes Kuznets curve Land reform Lorenz curve Neoclassical price-incentive model Personal distribution of income Poverty gap Progressive income tax Concepts for Review, cont’d
Public consumption Quintiles Redistribution policies Regressive tax Size distribution of income Subsidy Workfare programs Concepts for Review, cont’d