Download
1 / 11
110 likes | 374 Vues
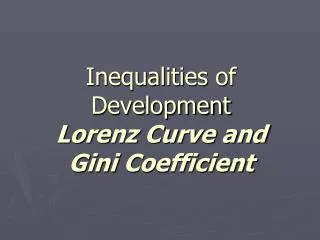
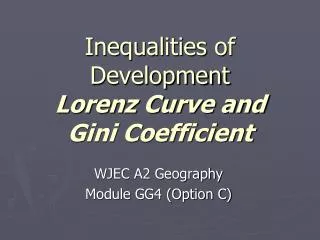
Inequalities of Development Lorenz Curve and Gini Coefficient. WJEC A2 Geography Module GG4 (Option C). How evenly spread is the world’s wealth?. World distribution of wealth (PPP) Lorenz Curve. Line of total integration. Cumulative Wealth (PPP). Cumulative Global Population.

E N D
Inequalities of DevelopmentLorenz Curve and Gini Coefficient WJEC A2 Geography Module GG4 (Option C)
World distribution of wealth (PPP) Lorenz Curve Line of total integration Cumulative Wealth (PPP) Cumulative Global Population
World distribution of wealth (PPP) Lorenz Curve The richest 10% possessed 46.9% of the world wealth in 1988. Line of total integration Cumulative Wealth (PPP) Cumulative Global Population
World distribution of wealth (PPP) Lorenz Curve The richest 10% possessed 50.8% of the world wealth in 1993. Line of total integration Cumulative Wealth (PPP) Cumulative Global Population
World distribution of wealth (PPP) Lorenz Curve Line of total integration Cumulative Wealth (PPP) The greater this area the more unequal the distribution Cumulative Global Population
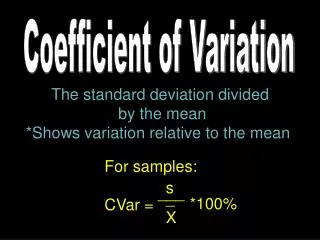
What is a Gini Coefficient? • The Gini coefficient, invented by the Italian statistitian Corado Gini, is a number between zero and one that measures the degree of inequality in the distribution of something. • The coefficient would register zero (0.0 = minimum inequality) for a society in which each member received exactly the same amount. • A coefficient of one (1.0 = maximum inequality) would mean one member got everything and the rest got nothing.
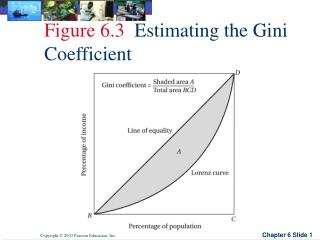
Calculating the Gini Coefficient Although the Lorenz Curve is good visual indicator of distribution equality, the Gini Coefficient provides a clearer quantatitive value. A / B = Gini Values should lie between 0 (total integration) to 1 (total segregation). B Line of total integration Cumulative Wealth (PPP) A Cumulative Global Population
Tasks • Plot Lorenz Curves for 1988 and 1993 data on graph paper. Answer • Calculate the Gini Coefficient for both. What do these tell you about trends in world distribution of wealth between 1988 and 1993? Answer • Economist’s estimate that the world's Gini coefficient fell to 0.63 in 1998 from 0.66 in 1970. Plot a graph to show fluctuations over time. Answer
What are typical Gini Coefficients for countries around the world? In practice, coefficient values range from around 0.2 for historically equalitarian countries like Bulgaria, Hungary, the Slovak and Czech republics and Poland to over 0.6 for Central and South American countries (such as Brazil) where powerful elites dominate the economy. The evolution of the Gini coefficient is particularly useful as it reveals trends. It shows the evolution towards greater equality in Cuba from 1953 to 1986 (0.55 to 0.22) and the growth of inequality in the USA in the last three decades during which the Gini went from 0.35 in the '70's to 0.40 now (and it is still rising!). Most European countries and Canada rate around 0.30, Japan and some Asian countries get around 0.35, some reach 0.40 while most African countries exceed 0.45. Source:http://berclo.net/inden.html
A Fairer Future for the World? • Global trends for the Gini coefficient of wealth can be rather confusing and distorted by the rapid growth of large Tiger Economies like China. • “The gap between the worlds’s rich and poor has never been wider. Malnutrition, AIDS, conflict and illiteracy are a daily reality for millions.” MakePovertyHistory.ORG