Download

1 / 59
590 likes | 745 Vues
Price Elasticity, Tax Incidence, Income Distribution, Lorenz, GINI. How will an internet tax effect sales?. Ch 5 Appendix, Ch 3:57-8 & Ch 18: 381-401. Tips for Navigation in the presentation:.

E N D
Price Elasticity, Tax Incidence, Income Distribution, Lorenz, GINI How will an internet tax effect sales? Ch 5 Appendix, Ch 3:57-8 & Ch 18: 381-401 Tips for Navigation in the presentation: Right mouse click to advance, or Use the arrow keys to navigate in the presentation : the up or right arrow to advance, the down or left arrow to go back; Source: WSJ 12/8/03 The image of the house appears on every slide in the upper left and operates as a hyper link to the slide “Lecture Outline”
Discussion: Gas Tax Holiday • Clinton, McCain Supports, Obama Opposes • Proposal would eliminate the $0.18 for summer 2008 • What would be the effects? • Would oil companies reduce their price by the amount of the tax • the competitive model predicts they would, but is it a competitive market? • Would consumers react by increasing demand • to store gas because of the expectations effect of the subsequent price increase? • Is the increase in quantity demand good for long term oil policy? • What will be the effect of reduced tax revenues on highway repair spending and jobs? • Source of article and a graphic of tax savings for state tax holiday by state
Internet Tax: Its Time Has Come? • This is becoming thought of as a benefit tax, especially since internet sales are a way of avoiding the sales tax. • Most people know that sales tax often isn't charged on things bought online, like Amazon's books and records. Technically, Web shoppers are supposed to pay all their local sales taxes. But online retailers, unlike offline stores, currently aren't being forced to collect them. • This de facto moratorium is slowly coming to an end. A growing number of online retailers are voluntarily charging tax, according to where a buyer resides, as are many catalog companies, including Lands' End. Congress is considering a bill that would, in effect, allow states to force Web retailers to charge sales tax. • These are all welcome developments. The rise in e-commerce is slowly depriving already cash-strapped local governments of crucial revenue. What's more, the online sales-tax break is disproportionately enjoyed by the more affluent part of the population, those who have PCs and shop online. • Source: PORTALS: Slick, Deft Amazon Becomes All Thumbs When Handling Taxes, Lee Gomes. Wall Street Journal. (Eastern edition). New York, N.Y.: Oct 6, 2003. pg. B.1 k (the article is in the Uconn Electronic Library -- you have to be logged into the Uconn VPM server, or be on-campus)
Lecture Outline • 1.0 First Slide of Presentation • 2. Tax Principles: Benefit, Ability to Pay • 3. Tax Shifting • 4. Taxes and The Distribution of Income • 5. Poverty • End of Presentation
2.0 Tax Principles • 2.1 Tax Principles • 2.2 Ability to Pay • 2.3 Benefit • 2.4 Behavioral Incentive
2.1 Tax Principles • Some think taxes should be based on the principle of ability to pay. • Others think taxes should be based on the principle of benefits received. • Another use is to discourage socially undesirable behaviors: pollution and health risk are 2 examples • Tax incidence indicates who actually bears the burden of the tax.
2.2a Ability to Pay • Example: Personal Income Tax • Tax owed depends on ability to pay as measured by income • Rising marginal tax rates makes the burden larger on those with greater ability to pay
2.2b Income Elasticity of State Tax Systems • A consequence is that tax revenues fall when the economy falls into recession • The summer 2008 found many state governments facing budget shortfalls and having to make deep budget cuts. CT was one of these states. • Source: WSJ article 7/24/08
2.3a Benefit Principle • Three years after enacting the first toll hikes since 1988, the Thruway Authority board decided on Friday to tap motorists again to help fund $2.1 billion in repairs to the 641-mile highway system and state canals. • "The Thruway toll increase is unfair to drivers who are being asked to tighten their belts every day in these troubled economic times," said Gov. David Paterson, who noted that he has asked all agencies under his authority for 3.35 percent cuts in spending. • "For the authority to increase tolls now, without a commitment to take every possible step to reduce spending, runs against the state's goal of fiscal restraint in the face of a national economic downturn," Paterson said. • Thruway Board Chairman John L. Buono said the toll increase is necessary because, at more than 50 years old, the highway's repair and maintenance needs are becoming more costly and crucial. • source
2.3b Gas Tax • The gas tax is another example of a benefit tax. • The gas tax is paid by users of highways and the gas tax revenues go to the highway trust fund dedicated to the building highways and bridges. • A good idea, but it can have unexpected problems. • Funding problems can develop, as for example, when gas prices rise and demand becomes elastic, there is a revenue squeeze for long term highway construction projects. As in the case of Summer 2008. Before its collapse in 2008, the Interstate 35W bridge in Minneapolis was part of the one quarter of the nation's bridges that are considered either 'functionally obsolete' or 'structurally deficient.' Source: WSJ 7/28/08
2.4 Discourage Socially Undesirable Behaviors • Cigarette and carbon taxes are examples. Cigarette Tax
3.0 Tax Sifting TAXES • 3.1 Categories of Tax Incidence/Shifting • 3.2 Diagrammatic Illustration -- Sales Tax • 3.3 Tax Shifting and Elasticity • 3.4 Elasticity and Total Tax Revenue • 3.5 Flash Module for Tax Shifting
3.1.a Tax Incidence • Statutory Impact (legal) • The individual or organization described in the statute as liable for the tax • Incidence (economic) • the individuals that ultimately bear the burden of the tax
3.1.b Tax Shifting • Tax Incidence: to determine this we first have to analzse tax shifting. • Tax shifting • Occurs when the burden of the tax moves from its point of statutory impact to its final point of resting • It occurs when the taxed party changes their behavior • That behavior change is represented by a shift in the relevant demand/supply curve
3.1.c The Sales/Excise Tax • First Example • Excise Tax • Statutory Liability is on the Seller • The seller sends in the tax payment • The seller also raises prices • Represent this by a leftward (backward) shift of the supply curve
3.2 a Representation of a Sales Tax Before the tax is imposed, the intersection of demand and supply yields a market price of $1.00 per ounce and a market quantity of 10 million ounces per day. (a) Less elastic demand St Suppose a tax of $0.20 is imposed on each ounce sold. Recall that the supply curve represents the amount that producers are willing and able to supply at each price. S $1.15 $1.00 $0.20 Tax • Since the government now gets $0.20 for each ounce sold, that amount must be added to the original supply curve to get a supply curve that includes the tax • the shift in the supply curve from S to St reflects the decrease in supply resulting from the tax • the effect of the tax is to shift the supply upward by the amount of the tax. D Price per ounce 0 Millions of ounces per day 9 10
3.2b Tax Shifting: Buyer and Seller Tax Burdens SUMMARY Old Price 15 Tax 10 New Price 20 Buyer Burden 5 Seller Burden 5 Buyer Burden $10 Tax Buyer Burden • EXCISE TAX CONSUMPTION TAX 20 20 15 15 Seller Burden Seller Burden 10 10 Tax
3.2 c Shifting the Sales Tax The result of the tax is to raise the equilibrium price from $1.00 to $1.15 and to decrease the equilibrium quantity from 10 million to 9 million ounces. (a) Less elastic demand St S Thus, consumers pay $1.15, or $0.15 more per ounce, and producers receive $0.95 after the tax, or $0.05 less per ounce. Consumers pay $0.15 of the tax as a higher price and producers pay $0.05 as a lower receipt. $1.15 $1.00 $0.20 Tax 0.95 The shaded area shows the tax collected, which equals the tax per ounce of $0.20 times the 9 million ounces sold $1.8 million in tax revenue per day. D Price per ounce 0 Millions of ounces per day Graphically, the upper shaded area shows the tax paid by the consumers through a higher price. 9 10 The lower portion showing the tax paid by producers through a lower net-of-tax receipt.
3.3a TAX SHIFTING: Role of Elasticites • The elasticities of Supply and Demand determine the buyer/seller share’s of the tax burden • The more inelastic demand is relative to supply the greater the buyer burden • The more inelastic supply relative is to demand the greater the seller burden • Time horizon • in the short run the burden is more likely to stay at the point of impact • in the longer run, adjustments are more likely to shift the burden
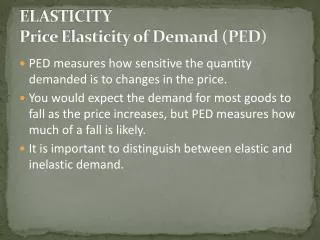
3.3c Tax Shifting: Demand Elasticity Again • The more price elastic the demand, the more the tax is paid by producers as a lower net-of-tax receipt and the less it’s passed on to consumers as a higher price • The less price elastic the demand, the more the tax is paid by consumers as a higher price and the less is paid by producers as a lower net-of-tax receipt
3.4a Tax Shifting: Demand Elasticity and Total Revenue • The total tax revenue is greater the more price inelastic is demand, because the reduction in quantity transacted is smaller than otherwise. • Governments tend to tax products with inelastic demand • Cigarettes • Liquor • Gasoline • Gambling
3.4b Tax Shifting: Supply Elasticities Panel A Panel B (a) Supply More elastic than Demand (b) Supply Less Elastic than Demand St' $0.20 Tax S' $1.15 $0.20 Tax $1.05 $0.15 $0.05 $1.00 $1.00 0.95 D'' 0.85 D'' Price per ounce Price per ounce St'' S´´ Millions of ounces per day 0 0 Millions of ounces per day 9 10 8 9 10 The same demand curve appears in both panels. In (a) the price rises to $1.15 or $0.15 above the pretax price of $1.00, while in (b) the price increases by only $0.05 Equilibrium price = $1.00, and equilibrium = 10 million ounces of tea leaves per day. More tax is passed on to consumers where supply is more elastic (panel a). Less tax is passed on to consumers where supply is less elastic (panel b). Sales tax of $0.20 per ounce is imposed, supply decreases in both (a) and (b) to reflect the tax.
3.4c Tax Shifting: Supply Elasticity Summary • The more elastic the supply, the less the tax is paid by producers as a lower net-of-tax receipt and the more is passed on to consumers as a higher price • The less elastic the supply, the more the tax is paid by producers as a lower net-of-tax receipt and the less is passed on to consumers as a higher price
3.4d Tax Shifting: Polar Cases (a) Supply More elastic than Demand (b) Supply Less Elastic than Demand St' S' $0.20 Tax $1.20 $0.20 Tax $0.20 $1.05 $0.05 $1.00 $1.00 0.95 D'' 0.85 D'' Price per ounce Price per ounce St'' S´´ Millions of ounces per day 0 0 Millions of ounces per day 9 10 8 9 10 In (a) the price rises to $1.20 or $0.20 above the pretax price of $1.00, while in (b) the price increases by only $0.05 to $1.05 The same supply curve appears in both panels. Equilibrium price = $1.00, and equilibrium = 10 million ounces of tea leaves per day. More tax is passed on to consumers where supply is more elastic (panel a). Less tax is passed on to consumers where supply is less elastic (panel b). Sales tax of $0.20 per ounce is imposed, supply decreases in both (a) and (b) to reflect the tax.
4.0 Taxes and the Distribution of Income • 4.1 Taxes effect the Distribution of Income – • Regressive, 3.3 Proportional, Progressive 28 • 4.2 How the Income Distribution is measured: • Population Quintiles, 29 • 4.3 Lorenz Curve 31-33 • 4.4 GINI Coefficient 34-33 • 4.5 Trend in Income Inequality over Time 36 • 4.6 Taxes: Proportional, Flat 37 • 4.7 Determinants of Household Income 38-42 • Earnings, Number of Adult Workers • 4.8 Problems with the Measure of the Income Distribution 43-45
4.1 Taxes Effect Income Distribution • Their effect as measured a % of income and has 3categories: • Regressive: the burden falls as a percentage of income as income rises. Example: Payroll Tax • Proportional: the burden is constant as a percentage of income as income rises. Example: A proposed Proportional income tax • Progressive: the burden rises as a percentage of income as income rises. Example: The US Personal Income Tax
4.2a Income Distribution • Economists quantify the distribution of income and see how it has changed over time, focusing on the household as the unit of measure • After dividing the total number of U.S. households into five groups of equal size – quintiles – ranked according to income, we have Exhibit 1 by decade since 1970
49.9 46.6 43.7 43.3 Lowest Second Third Fourth Highest quintile quintile quintile quintile quintile 4.2b Share of Aggregate Household Income • Households in the lowest, or poorest, fifth of the population received only 4.1% of the income in 1970 • Households in the highest, or richest, fifth received 43.3% of the income • U.S. Census Bureau measures income after cash transfer payments are received but before taxes are paid. increase The share of income going to the top 5% of households has grown since 1980, accounting for all the growth in the top 20% of households decrease • Share of income going to the top fifth has increased • Share going to the bottom fifth has decreased slightly Top 5 % Primary contributor to the larger share going to the highest group has been the growth of two-earner households in the top growth and the growth in single-parent households in the bottom group. Middle 60 percent
4.3a Lorenz Curve • The Lorenz curve is another way to picture the distribution of income in an economy • The Lorenz curve shows the percentage of total income received by any given percentage of households when incomes are arrayed from smallest to largest • Exhibit 2 provides the Lorenz Curve
4.3b Lorenz Curve Cumulative percentage of households is shown along the horizontal axis, and cumulative percentage of income is on the vertical axis. If income were equally distributed, each 20% of households would receive 20% of the total income the Lorenz curve would be the straight line shown in blue. As distribution becomes more uneven, the Lorenz curve is pulled down and to the right, away from the line of equal distribution. . a . Line of equal distribution b Point aon the 1970 Lorenz curve (in red) indicates in that year the bottom 80% of families received 56.7% of the income and the top 20% received 43.3% of the income. Point b on the 2000 Lorenz curve (in green) shows the bottom 80% received 50.6% of the income and the top 20% received 49.4% of the income. Since the Lorenz Curve for 2000 is farther from the line of even distribution than it was for 1970, income has become more unevenly distributed.
4.3c Lorenz Curve Special Cases The blue diagonal represents if income were equally distributed, each 20% of households would receive 20% of the total income The blue diagonal represents distribution becomes more uneven, and 100% of the income is received by the top 1% of families. Then the Lorenz curve is pulled down and to the right, away from the line of equal distribution. . a . Line of equal distribution b
4.4a Gini Coefficient • This index measures the degree of inequality in the distribution of family income in a country. • The index is calculated from the Lorenz curve, in which cumulative family income is plotted against the number of families arranged from the poorest to the richest. The index is the ratio of (a) the area between a country's Lorenz curve and the 45 degree helping line to (b) the entire triangular area under the 45 degree line. • The more nearly equal a country's income distribution, the closer its Lorenz curve to the 45 degree line and the lower its Gini index, e.g., a Scandinavian country with an index of 25. • The more unequal a country's income distribution, the farther its Lorenz curve from the 45 degree line and the higher its Gini index, e.g., a Sub-Saharan country with an index of 50. • If income were distributed with perfect equality, the Lorenz curve would coincide with the 45 degree line and the index would be zero; • if income were distributed with perfect inequality, the Lorenz curve would coincide with the horizontal axis and the right vertical axis and the index would be 100. Source
4.4b Gini Coefficient • t is also a measure of the inequality of a distribution. If the area between the line of perfect equality and Lorenz curve is A, and the area under the Lorenz curve is B, then the Gini coefficient is A/(A+B) . Since (A+B)=.5 , the Gini coefficient, G=A/(.5)=2A=1-2B . • Some important properties of the Gini coefficient are: • The Gini coefficient is a measure of inequality of a distribution. It is defined as a ratio with values between 0 and 1: the numerator is the area between the Lorenz curve of the distribution and the uniform (perfect) distribution line; the denominator is the area under the uniform distribution line. • The higher the Gini coefficient, the greater the inequality. • A value of zero corresponds to perfect income equality (everyone has the same income), while a value of 1 corresponds to perfect income inequality (one person has all the income, and the rest of the population has none). • It does not indicate how the inequality is distributed, only the total amount of inequality. • The Gini coefficient can be used to indicate how a distribution changes over time and if this change shows that equality is increasing or decreasing. • For an explanation of the calculation of the GINI Coefficient, and the plotting of the Lorenz Curve in a web tutorial click here Source
4.4c Elite loss and Rebound, Income Inequality Rose Substantially in 2004 • Income inequality, using measurements from the latest IRS Statistics of Income on U.S. Tax Units shows an increase in 2004. • Basically, top incomes took a hit in 2001-2002 from capital losses, with spillovers to executive compensation. But top incomes started to pull ahead again in 2003, and there's every indication that when we get data for 2005 and 2006 they'll show a new surge. The graph above plots the Gini index of IRS data calculated going back to 1990 and extending up until 2004 (most recent data available from the IRS). The Gini index rose by 2.9 percent or about 0.016 points. The Gini index is closing in on the peak of U.S. income inequality Gini index for U.S. Tax Units, 1990-2004 calculated by Thomas Volscho from IRS Statistics of Income data on Adjusted Gross Income. Dept. of Sociology, University of Connecticut. Source
4.5 Proportional and Flat Taxes • Flat Proportional Tax: leaves Lorenz Curve unchanged • Flat Amount Tax moves Lorenz curve to the right • In the session 04 Learning Module the Excel Exercise has a structured example so you can prove to yourself that a proportional tax does not change the Lorenz Curve (select tab “Example (3)”.
4.6a Determinants of Household Income • In a market economy, income depends primarily on earnings, which depend on the productivity of one’s resources • Determinants: • Educational Attainment • Industrial Structure • Family Structure
4.6b Educational Attainment (Labor Supply) • Incomes also differ for all the reasons labor incomes differ, such as differences in education, ability, job experience, and so on • Differences in earnings based on age and education reflect a normal life-cycle pattern of income • In fact, most income differences across households reflect the normal workings of resource markets, whereby workers are rewarded according to their productivity • Contributing to the dominance of the top group is a growing premium paid those with a college education for a number of reasons
4.6c Industrial Structure (Labor Demand) • Trends such as industry deregulation, declining unionization, and freer international trade have reduced the demand for workers with less education • New computer-based information technologies have reduced the demand for low-skilled clerical workers • The supply of less-educated workers increased more than the supply of more-educated workers
4.6d Family Structure • One reason household incomes differ is that the number of household members who are working differ • For example, over two-thirds of households in the bottom 20% are headed by unmarried females
4.6e Other • Others may face limited job choices and reduced wages because of • age, • discrimination, • bad luck,
4.7a Big Picture Problems with Distribution Benchmarks • First is that there is no objective standard for evaluating income distributions • The usual assumption is that a more equal distribution is more desirable, but is a perfectly even distribution most preferred? • A “normative’ not a “positive” economic issue • A problem with allocating income according to productivity is that some people have difficulty earning income • Some have mental and physical disabilities • A problem with reducing inequality is the potential for an adverse effect on work incentives
4.7b Problems with Distribution Benchmarks: Conceptual -- Using Consumption instead if Income as the base • Third, a better measure of household welfare might be the distribution of expenditures • Evidence on expenditures indicates that spending by quintiles is much more evenly distributed than income • Reflects the life cycle pattern that expenditures needs are fairly constant over a life cycle, but earnings are typically highest in middle age Income Spending
4.7c Problems with Distribution Benchmarks: Minor Caveats • A second problem is that most distributions measure money income after cash transfers but before taxes, • it omits the effects of taxes, • overstates the share of income going to upper income groups • It omits in-kind transfers such as food stamps and free medical care • understates the share of income going to lower income groups
5.0 Poverty • 5.1 The Level of Poverty 475.2 How it is measured: Orshansky Food Budget 48 • 5. 3 Trend over Time 49-51 • 5.4 Problems with the Measure 52 • 5.5 Programs to reduce Poverty 53-59 • TANF, Earned Income Credit Food Kitchen
5.1 The Level of Poverty • Since poverty is such a relative concept, how do we measure it objectively and how do we ensure that our measure can be applied with equal relevance over time? • The benchmark for poverty analysis is based on the assumption that the poor spend about one-third of their income on food (based on a consumption budget from 1954 ) the U.S. Department of Agriculture estimates the cost of a nutritionally adequate diet
5.2 How Poverty is Measured • This nutritionally adequate diet is then multiplied by three to generate the U.S. official poverty level • The poverty definition is based on pretax money income, including cash transfers, but it excludes the value of noncash transfers such as food stamps, Medicaid, subsidized housing, or employer provided health insurance • Exhibit 3 presents some basic poverty measures
5.3b Poverty has Fallen Among Poor Elderly • Exhibit 4: In 1959, the elderly were the poorest group, with a poverty rate of 35%. Since then, poverty among the elderly has declined to a record low of 9.7% in 2000. • This decline stems from tremendous growth in spending for Social Security and Medicare. • In real terms those two programs grew tenfold from $62 billion in 1959 to over $620 billion in 2000, measured in 2000 dollars. • Thus, while not welfare programs in a strict sense, Social Security and Medicare have been extremely successful in reducing poverty among the elderly.