Coefficient of Determination
260 likes | 717 Vues
Coefficient of Determination. Section 3.2C. Using the Calculator. The regression line can be found using the calculator Put the data in L1 and L2. Press Stat – Calc - #8 (or 4) - enter To get the correlation coefficient and coefficient of determination to show… Press 2 nd catalog (0)

Coefficient of Determination
E N D
Presentation Transcript
Coefficient of Determination Section 3.2C
Using the Calculator • The regression line can be found using the calculator • Put the data in L1 and L2. • Press Stat – Calc - #8 (or 4) - enter • To get the correlation coefficient and coefficient of determination to show… • Press 2nd catalog (0) • Press D • Go to Diagnostic on – press enter until you see “done”
The following table lists the total weight lifted by the winners in eight weight classes of the 1996 Women’s National Weightlifting Championship Find LSRL Find the correlation coefficient. Find the residual for a 64 kg weight class. Check out the residual plot.
If a line is appropriate, then we need to assess the accuracy of predictions based on the least squares line.
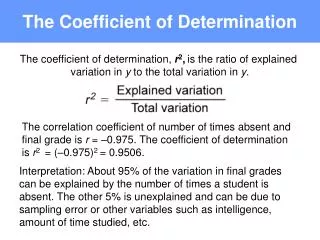
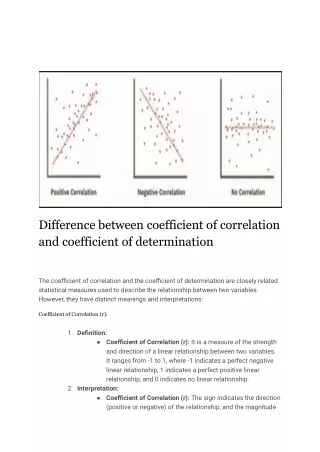
Coefficient of Determination It’s the measure of the proportion of variability in the variable that can be “explained” by a linear relationship between the variables x and y.
Example This relationship explains 100% of the variation in Cost.
But the line doesn’t always account for all of the variability. This doesn’t!
Total Sum of Squares • Measures the total variation in the y-values. • It’s the sum of squares of vertical distances
Sum of Squared Errors • This is the sum of the squared residuals • Total of the unexplained error • Formula:
Coefficient of Determination • It’s the percent of variation in the y-variable (response) that can be explained by the least-squares regression line of y on x. • Formula:
For height and shoe size – find and interpret the coefficient of determination.
For height and shoe size – find and interpret the coefficient of determination. Approximately 83% of the variation in shoe size can be explained by height.
Interpret this in context… 59.5% of the observed variability in mean number of runs per game can be explained by an approximate linear relationship between Team Batting average and mean runs per game.
Another example: If r = 0.8, then what % can be explained by the least squares regression line?
Another example: A recent study discovered that the correlation between the age at which an infant first speaks and the child’s score on an IQ test given upon entering school is -0.68. A scatterplot of the data shows a linear form. Which of the following statements about this is true? A. Infants who speak at very early ages will have higher IQ scores by the beginning of elementary school than those who begin to speak later. B. 68% of the variation in IQ test scores is explained by the least- squares regression of age at first spoken word and IQ score. C. Encouraging infants to speak before they are ready can have a detrimental effect later in life, as evidenced by their lower IQ scores. D. There is a moderately strong, negative linear relationship between age at first spoken word and later IQ test score for the individuals this study.
Homework • Page 192 (49, 51, 54, 56, 58, 71-78)