Download

1 / 9
120 likes | 307 Vues
Coefficient of Determination and Residual Graphs. Here is a simple data set with a decent r value for n =11 data points. r > .602. Here is a simple data set with a decent correlation coefficient value “r” for n =11 data points. r > .602. Here is the regression equation with it’s

E N D
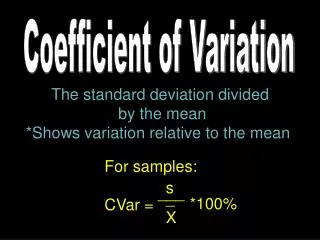
Here is a simple data set with a decent r value for n =11 data points. r > .602
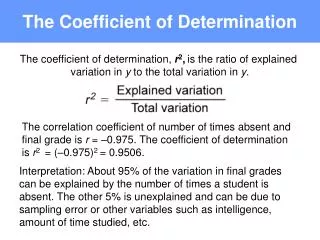
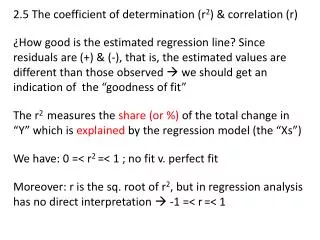
Here is a simple data set with a decent correlation coefficient value “r” for n =11 data points. r > .602 Here is the regression equation with it’s Coefficient of determination. .667 means the equation will only explain about 67% of the variation in the data. But what does that mean?
Here is a simple data set with a decent r value for n =11 data points. r > .602 You will notice we have not looked at the data in some graphical manner.
We can see the data is curved and so a line is really not a good predictor for this data. The data varies from the line. About 33% of the data variation is not covered by the line. 1- .67 = .33
Here is a curve of a parabola the covers almost all of the data points. The equation for this curve would be a better predictor for this data. Here we can see a much higher = 99.8 %. So 99.8% of the variation in the data is explained by the curve.
Now lets compare the residual graphs. We can see a definite pattern in this residual graph.
Now lets compare the residual graphs. There is no pattern is this residual graph.
The line data The line data residual The red curve The red curve residual