
Uploaded by
clare
1 SLIDES
265 VUES
10LIKES
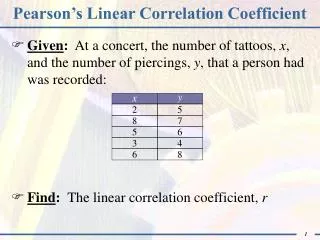
Correlation Coefficient
DESCRIPTION
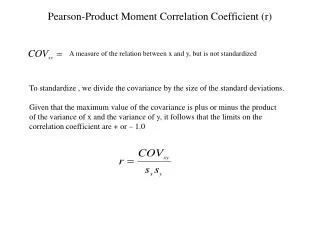
Pearson's correlation coefficient (r) measures the strength and direction of the linear relationship between two variables, X and Y. The formula is given by r = (Σ((Xi - X̄)(Yi - Ŷ))) / (n-1) * (σx * σy), where σx and σy are the standard deviations, and X̄ and Ŷ are the means of X and Y, respectively. A value of r close to 1 indicates a strong positive correlation, while a value close to -1 indicates a strong negative correlation. Understanding this coefficient is crucial for data analysis and interpretation in various fields.
Download

1 / 1
Télécharger la présentation 
Correlation Coefficient
An Image/Link below is provided (as is) to download presentation
Download Policy: Content on the Website is provided to you AS IS for your information and personal use and may not be sold / licensed / shared on other websites without getting consent from its author.
Content is provided to you AS IS for your information and personal use only.
Download presentation by click this link.
While downloading, if for some reason you are not able to download a presentation, the publisher may have deleted the file from their server.
During download, if you can't get a presentation, the file might be deleted by the publisher.
E N D
Presentation Transcript
Correlation Coefficient • Pearson’s r: • Where and are the standard deviation of x and y, and are the means


More Related
Audio
Live Player