Understanding Least Squares Fit and Correlation in Data Analysis
This overview discusses the least squares fit method used for data modeling, focusing on how to estimate changes in the response variable (y) related to changes in the predictor variable (x), specifically an increase of 7 in x. It highlights the significance of the correlation coefficient (r) as a measure of the strength of linear relationships between two quantitative variables. Additionally, it emphasizes that both least squares regression and the correlation coefficient are not resistant to outliers, potentially skewing results. Understanding residuals is also covered, detailing the difference between observed and predicted values.

Understanding Least Squares Fit and Correlation in Data Analysis
E N D
Presentation Transcript
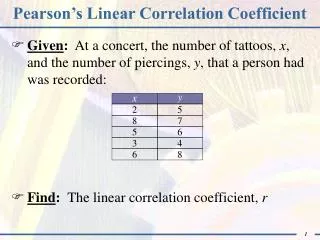
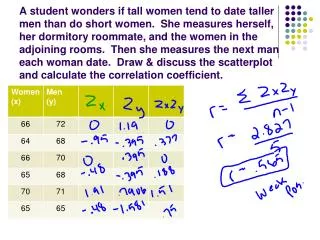
A least squares fit of some data collected gives the model What is the estimate increase in y that corresponds to an increase of 7 in x?
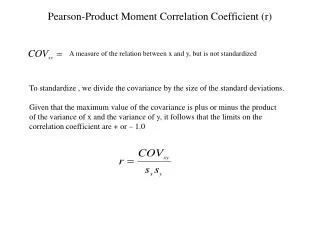
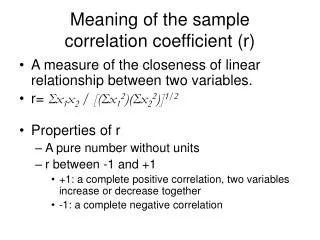
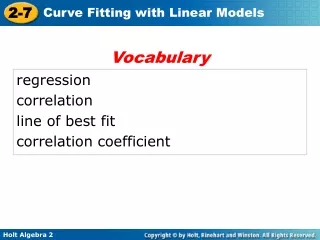
Correlation coefficient r • Correlation measures strength of 2 quantitative variables. • Tells us how close the data is to being linear • Have we ever changed r to a percent….. NO! • So don’t do it on the test
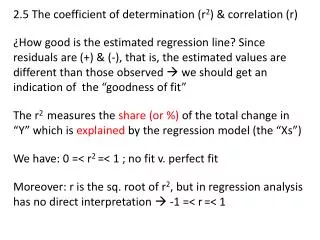
gives a measure of how successful the regression was in explaining the response. • % of the variation in either variable is the fraction of the variation in the values of y that is explained by the least-squares regression of y on x
Resistance measures • Plain and simple: the least square regression and correlation coefficient are NOT RESISTANT. • In other words they are easily influenced by unusual or extreme values. • See pg. 171-172
Residual • residual= observed -predicted