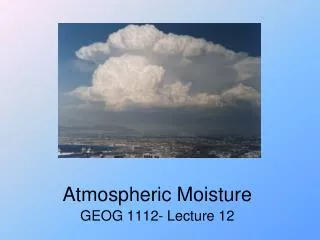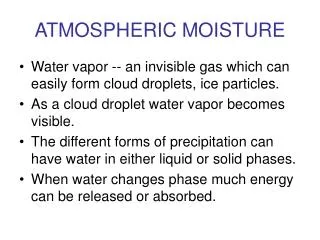
NATS 101 Lecture 9 Atmospheric Moisture
190 likes | 334 Vues
NATS 101 Lecture 9 Atmospheric Moisture. Hydrological Cycle. Ultimate source of all fresh water. 15%. 85%. 50%. 50%. Ahrens Fig. 4.1. 85% of water vapor in atmosphere evaporates from oceans.

NATS 101 Lecture 9 Atmospheric Moisture
E N D
Presentation Transcript
Hydrological Cycle Ultimate source of all fresh water 15% 85% 50% 50% Ahrens Fig. 4.1 85% of water vapor in atmosphere evaporates from oceans. About 50% of precipitation that falls over land is runoff, and the other 50% is transpired/evaporated. Water vapor molecules reside in atmosphere for one week.
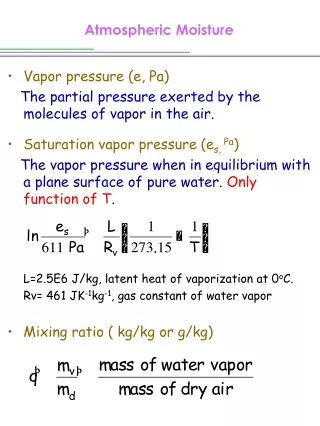
Humid Air • Humid air is a mixture of molecules that make up dry air (mostly N2 and O2) and lighter water vapor (H2O) molecules. • Each type of molecule contributes a fraction of total air pressure, or apartial pressure,proportional to the number molecules per unit volume. The partial pressure of water vapor is termed thevapor pressure.
Saturation Vapor Pressure • The partial vapor pressure at which the rate of evaporation equals the rate of condensation in a closed system is called thesaturation vapor pressureor SVP. The SVP effectively denotes the maximum water vapor that air the can “hold”. • SVP depends strongly on temperature. • Vapor pressure and SVP provide a measure of the actual water vapor content and the air’s potential capacity, respectively.
Williams p62 saturatedE=C warmedE>C cooled E<C dry E>C SVP depends on temperature. As temperature increases, more molecules are energetic enough to escape into the air. Concept applies to an ice surface. SVP over ice is lower because water molecules are bonded more tightly to ice. For the temperatures of interest, some water molecules are energetic enough to escape into atmosphere and SVP>0.
SVP and Temperature SVP nearly doubles with a 10oC warming SVP and T Graph Supercooled water droplets can exist to temps of -40oC For temps below 0oC, SVP runs 10%-30% lower over ice Ahrens Fig. 4.5
Relative Humidity Air with a RH=100% is said to besaturated. RH depends on air temperature (SVP). RH changes by either changing air’s water vapor content or the air’s temperature.
Relative Humidity Ahrens Fig. 4.6 The RH for constant water vapor content can fluctuate greatly during the course of the day solely from the temperature changes
Relative Humidity(Ahrens, Appendix B) Consider air that is saturated at 0oC TempVPSVPRH 0oC 6 mb 6 mb 100% 10oC 6 mb 12 mb 50% 20oC 6 mb 23 mb 28% 30oC 6 mb 42 mb 14% 40oC 6 mb 68 mb 9%
Dew Point • DP-temperature to which air must be cooled at constant pressure to become saturated. Higher DP Higher water vapor content. • DP is agood indicatorof the actual water vapor content since air pressures vary very little along the earth’s surface. • DP is plotted on surface weather maps. • DP depression (Temp-DP) is plotted aloft.
Arizona Dew Point Ranges Vapor PressureDew Point 24 mb 20oC 12 mb 10oC 6 mb 0oC 3 mb -10oC
Wet Bulb Temperature Wet Bulb Temp-Lowest temp to which air can be cooled by evaporation of water into it. Warmer than dew point since moisture is being added to air which raises dew point. Measured with slingpsychrometer. wet bulb dry thermometer Ahrens, Fig 4.9
Wet Bulb Temperature(Ahrens, Appendix D) Wet bulb temperature lies about 30% of the way from the dew point to the temperature Application-Wet bulb temp gives maximum possible efficiency for a swamp cooler MonthMAXDew PWet BulbJune 100oF 37oF 65oF July 100oF 63oF 75oF
Heat Index Humidity reduces the rate at which sweat evaporates. Thus, the cooling rate is lowered. Tucson Record MAX July MAX June MAX Rocky Pt Summer Ahrens, Fig 4.8
Humid Air is Less Dense Williams, p72
0.5% lighter Williams, p72
Summary: Moisture • Water vapor comes from the evaporation of sea water and resides in atmo. for ~1 week. • Air has a saturation level for water vapor • Saturation level depends on air temperature • Humid air is less dense than dry air • Water vapor content can be quantified by RH, dew point temp, wet bulb temp
Assignment for Next Lecture • Topic -Cloud and Fog Formation • Reading -Ahrens pages 89-96 • Problems -4.3, 4.13, 4.14, 4.15