Enhanced Probabilistic Forecasting at ECMWF: A Comprehensive Overview
440 likes | 530 Vues
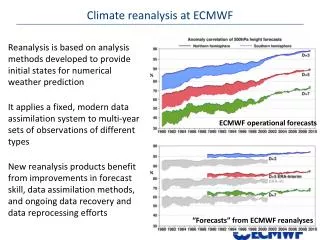
This article provides an in-depth look at the probabilistic prediction systems at the European Centre for Medium-Range Weather Forecasts (ECMWF). It covers operational systems, wave models, ocean analyses, and simulations of uncertainties for more accurate forecasting. The use of singular vectors, ensemble data assimilation, and stochastic schemes are discussed to enhance the forecasting capabilities of ECMWF.

Enhanced Probabilistic Forecasting at ECMWF: A Comprehensive Overview
E N D
Presentation Transcript
Probabilistic prediction at ECMWF Roberto Buizza European Centre for Medium-Range Weather Forecasts Acknowledgements to Magdalena Balmaseda, Laura Ferranti, Martin Janousek, Martin Leutbecher, David Richardson, Tim Stockdale, Frederic Vitart, and the Predictability Division.
Outline • ECMWF medium-range probabilistic forecast systems: the EPS • ECMWF seasonal probabilistic forecast systems: • The operational S3 and EUROSIP • The forthcoming S4 (Q4-2011) • Conclusions
Atmospheric model Wave model 1. Baseline operational systems (2011) HRES TL1279L91 (d0-10) EPS TL639L62 (d0-10) TL319L62 (d10-15/32) S3 TL159L62 (m0-7/13) Atmospheric model Wave model Ocean model Real Time Ocean Analysis ~8 hours Delayed Ocean Analysis ~12 days
Definition of the perturbed ICs NH SH TR Products 1 2 50 51 ….. 1. The operational ECMWF EPS • The operational version of the EPS includes 51 forecasts with resolution: • TL639L62 (~32km, 62 levels) from day 0 to 10 • TL319L62 (~64km, 62 levels) from day 10 to 15 (32 at 00UTC on Thursdays). • Initial uncertainties are simulated by adding to the unperturbed analyses a combination of T42L62 singular vectors, computed to optimize total energy growth over a 48h time interval (OTI), and perturbations generated using the new ECMWF Ensembles of Data Assimilation (EDA) system. • Model uncertainties are simulated by adding stochastic perturbations to the tendencies due to parameterized physical processes (SPPT and SPBS schemes). • The EPS is run twice a day, at 00 and 12 UTC.
1. Simulation on initial unc. with singular vectors Since its implementation in 1992, initial uncertainties have been simulated in the EPS using singular vectors, i.e. perturbations with the fastest finite-time growth rate. Perturbation growth can be measured in terms of total energy E with a total-energy norm, and a perturbation time evolution can be linearly approximated: Once the adjoint of the tangent forward propagator with respect to the total-energy norm is defined, total-energy singular vectors can be computed by solving an eigenvalue problem: time T
1. Simulation of initial unc. using the EDA Since 22 June 2010, differences between 6h perturbed forecasts from the ECMWF Ensemble Data Assimilation system have been combined with singular vectors to generate the EPS initial perturbations. The TL399L91 EDA perturbed analyses are generated by randomly perturbing the observations and the SST, and by running the forecast model with the SPPT stochastic scheme. The random perturbations are defined by sampling a normal distribution with the observation error standard deviation. It is worth to point out that since 18 May 2011, the EDA has been used to specify the background errors “of the day” in the high-resolution 4D-Var. U850 background error standard deviation Randomization method (ope, left) – EDA (cy36r4, right)
1. Simulation of model unc.: SPPT(1L) & SPPT(3L) 500 km 6 h 2000 km 30 d Since Oct 1998, the EPS has included a stochastic scheme designed to simulate random model errors due to parameterized physical processes [SPPT(1L)]. SinceNov 2010, the scheme includes a multi-scale pattern generator to account for parameterization errors on multiple spatial and temporal scales [SPPT(3L)]. 1000 km 3 d (from M Leutbecher)
1. Simulation of model unc.: SPBS Since Nov 2010, a stochastic backscatter scheme (SPBS) is also used in the EPS: • Rationale: a fraction of the dissipated energy is backscattered upscale and acts as streamfunction forcing for the resolved-scale flow (Shutts & Palmer 2004, Shutts 2005, Berner et al 2009) • Streamfunction forcing in the latest formulation (M Steinheimer and G Shutts, 2010) is given by : Recent improvements/updates include: • Revised convective dissipation calculation • Revised dissipation rate smoothing • Changed pressure dependency of vertical correlations • Option to force only part of the spectrum [reduces computational cost and avoids problems seen with small scale forcing (dissipation – forcing feedback, etc.)] Backscatter ratio Streamfunction forcing Total dissipation rate Pattern generator
1. The EPS re-forecast suite … 2 9 16 23 30 June … Some of the EPS products are bias corrected and calibrated using 450 EPS forecasts run for the past years: • 18 years (1993 – 2010) • 5 initial dates (ERA-I): -14d, -7d, 0, +7d, +14d • 5 members • Same model version • Same resolution • Same fc length • EDA initial perts from corresponding dates of current year (2011) • Daily SVs 2011 2010 5 5 5 5 5 5 5 5 5 5 51 T639 L62 5 5 5 5 5 5 5 5 5 5 5 5 5 5 5 5 5 5 5 5 5 51 T319 L62 5 5 5 5 5 5 5 5 5 2009 18y 2008 ….. 1993
1. EPS performance: T850 v an, NH The performance of the EPS has been improving continuously for upper level fields, as seen by looking at the RPSS for the t+72h, t+120h and t+168h probabilistic prediction of T850 over NH (verified against analyses). Results indicate a predictability gain of ~ 2 days/decade. (from M Janousek)
1. EPS performance: sp/sk relationship NH In Nov 2010, two major changes were introduced to further improve the EPS spread/skill relation: • The multi-scale SPPT(3L) replaced the original SPPT(1L), and SPBS was introduced • The amplitude of the SV-initial perturbations was reduced by 50% (from D Richardson)
1. EPS I-EFI for severe weather fc The EPS-based I-EFI and related products (EPSgram, CDF) have become key products used to predict severe weather conditions.
1. EPS & TIGGE: T850 NH, 2010, v ERA-int CRPSS for T850 over NH for 2010 verified against own analysis of the 4 best TIGGE ensembles: • ECMWF (red) • NCEP (green) • MetOffice (blue) • CMC Canada (violet) (from M Janousek)
1. EPS & TIGGE: T/V850 NH, D10-JF11, v ERA-int The skill of the TIGGE ensemble systems is continuously monitored. This figures show the CRPSS for T850 (left) and WS850 (right) over NH for D10-JF11 verified against own analysis of the 4 best TIGGE ensembles: ECMWF (red), NCEP (green), MetOffice (blue) and CMC Canada (violet). (from D Richardson)
1. EPS & TIGGE: TP NHx and WS850 TR The left figure shows the CRPSS for 24h accumulated precipitation verified against synop observations for 2010-11. The right panel shows the CRPSS of WS850 over the tropics for D10-JF11 verified against ERA-Interim. (from D Richardson)
1. EPS & TIGGE: 2mT EU, D08JF09, obs CRPSS for 2mT forecasts in DJF 2008/09 verified against observations at 250 European stations. Results are shown for the four single-models (dotted lines with symbols) contributing to the TIGGE-4 multi-model (solid line without symbols) and the reforecast calibrated ECMWF model (dotted line with bullet symbols). (from R Hagedorn)
1. 32d EPS scores over NH (ROCA) Results based on 45 cases (ICs 4 times a year from ‘91 to ’02, 5m) indicate that 32d EPS weekly average probabilistic forecasts of 2mT,MSLP and TP overNH land points have some level of skill up to forecast day 32. This is shown hereafter for the probabilistic prediction of occurrence of 2mT, MSLP and TP values upper tercile values. 2mT MSLP TP D5-11 D12-18 D19-25 D26-32 D5-11 D12-18 D19-25 D26-32 D5-11 D12-18 D19-25 D26-32 (from F Vitart)
1. EPS monthly extension: ROCA for 2mT over NH • The EPS forecast range is extended to 32-days twice-a-week (00UTC of Mon and Thu). The performance of EPS weekly-average forecasts has also been continuously improving up to fc-day 18 (left). The signal for longer fc days is weaker (right). This is shown here in terms of the ROC-area for the probabilistic prediction of 2mT in the upper tercile. Monthly Forecast d12-18 Persistence of day 5-11 Monthly Forecast d19-32 Persistence of day 5-18 Day 12-18 Day 19-32 (from F Vitart)
1. EPS d5-11 & d19-25 fcs: 2mT NA, D10J11 These plots show a time series of weekly average analysis (top row) and EPS ensemble-mean forecasts for d5-11 (middle row) and d19-25 (bottom row) 2mT forecasts over North America valid for the period 13 Dec ‘10-23 Jan ‘11. Red/blue shading indicate areas where the ensemble-mean is significantly (at 10% level) warmer/colder than the model climatology. 13-19 Dec ‘10 20-26 Dec 27 Dec-2 Jan ’11 3-9 Jan 10-16 Jan 17-23 Jan
1. EPS d5-11 & d19-25 fcs: 2mT EU, D10J11 These plots show a time series of weekly average analysis (top row) and EPS ensemble-mean forecasts for d5-11 (middle row) and d19-25 (bottom row) 2mT forecasts over Europe valid for the period 13Dec ‘10-23 Jan ‘11. Red/blue shading indicate areas where the ensemble-mean is significantly (at 10% level) warmer/colder than the model climatology. 13-19 Dec ‘10 20-26 Dec 27 Dec-2 Jan ’11 3-9 Jan 10-16 Jan 17-23 Jan
1. MJO: OLR anomalies at forecast day 15 This plot shows Hovmoeller diagrams of OLR from ERA40 (left panel) and forecasts at day 15 from 6 successive versions of the ECMWF model since the monthly forecasting system became operational. Results show that there has been a considerable improvement in the amplitude of the MJO since the monthly forecasting system became operational, especially after the revision of the convection scheme in 2007 (cycle 32r3). Despite these improvements, the propagation of the MJO is too slow over the Indian Ocean in the last model cycles. 29/12 05/01 12/01 20/01 28/01 04/04 12/02 ERA40 28R3 31R1 32R2 32R3 33R1 35R3 days 11/07 06/08 10/04 09/06 06/07 09/09 (from F Vitart)
1. EPS 32d (monthly) extension: MJO index To assess MJO skill, forecasts are projected into combined EOFs of U200, U850 and OLR (Wheeler & Hendon, 2004). The two dominant combined EOFs represent about 12% of the total variance each, and give a good representation of the MJO propagation. These plots show the skill of EPS forecasts of the MJO along these dominant EOFs. ‘Perfect model’ skill EPS ens-mean ‘Perfect model’ skill EPS ens-mean Model climatology Bivariate RMS error Bivariate Correlation (from F Vitart)
Outline • ECMWF medium-range probabilistic forecast systems: the EPS • ECMWF seasonal probabilistic forecast systems: • The operational S3 and EUROSIP • The forthcoming S4 (Q4-2011) • Conclusions
2.a Seasonal prediction: S3 (2006-2011) IFS 31R1 1.1 deg. 62 levels HOPE ~ 1.4 deg. lon 1.4/0.3 d. lat. OASIS-2 TESSEL Ens. Forecasts Initial Con. 4-D variational d.a. Gen. of Perturb. System-3 CGCM Multivar. O.I.
2.a S3 initial and model uncertainties S3 simulates both initial and atmospheric model uncertainties: • Initial uncertainties: • Ocean: initial uncertainties are simulated by using a 5-member ensemble ocean assimilation system. Each analysis is created by using perturbed versions of the wind forcing. • SST: Prior to starting our coupled model forecasts, the ocean analyses are further perturbed by adding estimates of the uncertainty in the sea surface temperature to the ocean initial conditions. • Atmosphere: initial uncertainties are simulated using SVs • Model uncertainties: • Atmosphere: model uncertainties are simulated by the SPPT scheme (as in the EPS)
2.a S3 Ocean ICs: real-time analysis The ocean analysis is performed over a 10 day window. All obs within a centered 10-days window are gathered and quality controlled. In the S3 HOPE-OI system, in addition to subsurface temperature, the scheme assimilates altimeter derived sea-level anomalies and salinity data.
2.a S3 1-year ENSO outlook: 2009-2010 The tropics is the area where seasonal predictability is higher, controlled mainly by ENSO, a coupled ocean-atmosphere phenomenon centred over the tropical Pacific. S3 13m integrations are generated every quarter, based on an 11-member ensemble. They gave good predictions of the most recent El Nino events.
2.a S3 2mT-anomaly fcs from 1 Dec: ave ROCA These plots show a measure of the accuracy of seasonal probabilistic forecasts, the area under the Relative Operating Characteristics (ROCA) of the probabilistic forecasts of the 2mT anomaly being below the lower tercile forecasts with 1 Dec starting date. The ROCA has been evaluated considering S3 25-years (1985-2005) 11-member hindcasts. The left panel shows the ROCA of the 2-4m average forecast, and the right panel the ROCA of the 5-7m average forecast.
2.a S3 Accumulated Cyclone Energy (ACE) forecast One of the operational seasonal forecasts is ACE (an index of storm activity defined by the sum of the square of the estimated maximum sustained velocity of every active tropical storm). The left panel shows the ACE forecast issued on 1 June 2010 for JASOND10. The right panel shows that the accuracy of this product over WPAC (CC 52%). (from F Vitart)
2.a EUROSIP EUROSIP is a multi-model seasonal forecasting system consisting of three independent coupled systems: ECMWF, Met Office and Météo-France (all integrated in a common framework). This table summarizes the configuration of the 3 seasonal systems that are currently used to generate EUROSIP operational products. NCEP will be joining very soon. Germany and Canada has expressed interest to join as well.
2.a S3 & EUROSIP 6m ENSO outlook: 1 Dec 08 EUROSIP is a multi-model seasonal forecasting system consisting of three independent coupled systems: ECMWF, Met Office and Météo-France (all integrated in a common framework). NCEP will be joining soon. ECMWF (left) and EUROSIP 3-system SST anomaly forecasts for NINO3.4 area issued on 1 Dec 2008 and valid for 6 months. The observed SST anomaly lies at the edge of the ECMWF plum. Compared to the single ECMWF plum, the EUROSIP plum has a larger dispersion and gives a higher probability of cold conditions.
2.a S3 & EUROSIP 6m ENSO outlook: 1 Oct 09 ECMWF (left) and EUROSIP 3-system SST anomaly forecasts for NINO3.4 area issued on 1 Oct 2009 and valid for 6 months. In this case the observed SST anomaly lies outside the edge of the ECMWF plum. Compared to the single ECMWF plum, the EUROSIP plum has a larger dispersion and includes the observed SST within the forecast range.
2.a S3 & EUROSIP: 1 Nov fcs of 2mt for D10JF11 2mT analysis • Pac: good distribution of temp anomalies • Mid-lat Atl and Indian Ocean: colder than fcs • Austr: cold conditions were predicted although the amplitudes underestimated • Eur: cold temperatures were not predicted • Greenland, West Canada and West Asia: good predictions of warm/cold/warm anomalies (from L Ferranti)
2.b The forthcoming S4 (Q4-2011): main features • New ocean model: NEMO v. 3.0 + 3.1 coupling interface, ORCA-1 configuration (~1-deg. resol., ~0.3 lat. near the equator) , 42 vertical levels, 20 levels with z < 300 m • 3D variational ocean data assimilation (NEMOVAR) • New physics package, including HTESSEL land-surface scheme, snow model (with EC-Earth), new land surface initialization • Prescribed sea-ice concentration with sampling from recent years
2.b The S4 hindcasts J F M A M ….. Seasonal products are bias corrected and calibrated using 450 S4 forecasts run for the past years: • 30 years (1981 – 2010) • 15 members (up to 7m, extended to 13m every quarter) • Same model version • Same resolution • ICs from ERA-I and ORAS4 • Same initial perts 2011 15*T255L91 51*T255L91 51*T255L91 51*T255L91 15*T255L91 15*T255L91 15*T255L91 15*T255L91 15*T255L91 15*T255L91 2010 30y …. 1981
2.b S4 ocean re-analysis (ORAS4) • Based on NEMO/NEMOVAR • Model configuration: ORCA1, smooth coastlines, closed Caspian Sea • Forced by ERA40 (until 1989) + ERA Interim (after 1989) • Assimilates Temperature/Salinity from EN3 and altimeter data • Strong relaxation to SST (OI_v2) • Online bias correction scheme • This plot shows the time evolution of the ocean heat content in ORAS4 (anomalies respect the period 1960-2010) for 3 different depth ranges. Around 2002, the warming stabilizes in the upper ocean, but continues in the deeper ocean. The implication is that the ocean may be absorbing more heat than anticipated. (from M Balmaseda)
2.b Impact of ocean DA on SST forecasts S4 experiments (20years, 11-member ensembles) indicate that ocean data assimilation with NEMOVAR improves the SST forecast skill at different lead times and different regions. (from M Balmaseda)
2.b S4 re-scaled SST plume anomalies S4 SST forecasts are re-scaled to correct for the too large variability, with re-scaling coefficients computed in cross-validation mode. SST forecast amplitudes are substantially too large in S4, and the re-scaling is important to give reasonable RMS error scores (and, more importantly, accurate forecast plumes). (from T Stockdale)
2.b S4 and S3 NINO3.4 and EQATL SST fcs Preliminary results based on 18y 15m hindcasts indicate that S4 has more realistic spread. In terms of skill, over the EC-Pac the re-scaled S4 ensemble-mean forecasts are better (see plot for NINO3.4), but over West-Pac are comparable. Over the Atlantic, re-scaled S4 ensemble-mean forecasts are more skilful. (from T Stockdale)
2.b S4 and S3: comparison based on 18y hindcasts • Preliminary results based on hindcasts run for 18 years indicate that the S4 model climate is better (see plot that shows U925 model biases of S3 and S4) • S4 atmospheric scores are less well sampled at this stage, but are in the positive to neutral range • S4 forecasts are not better over the West Pacific mainly because of too strong easterlies in the equatorial Pacific (from T Stockdale)
Outline • ECMWF medium-range probabilistic forecast systems: the EPS • ECMWF seasonal probabilistic forecast systems: • The operational S3 and EUROSIP • The forthcoming S4 (Q4-2011) • Conclusions
3. Conclusions • Ensemble-based systems are used at ECMWF to estimate not only the most-likely scenario but also its uncertainty: • In the analysis with the Ensemble Data Assimilation system (EDA, since Jun 2010) • In the medium-range (<1m) with the Ensemble Prediction System (EPS, since 1992) • In the seasonal range (<13m) with seasonal System-3 (S3, since 1998) • The EPS uses a combination of EDA- and SV-based perturbations to simulate initial uncertainties, and stochastic schemes to simulate model uncertainties. It is based on 51 forecasts run with a 639v319L62 atmosphere model. It is coupled to the HOPE (1.0-0.3 deg) ocean model from day 10, and is run twice a day. Forecasts starting at 00UTC on Mon & Thu are extended to 32days. In Q3-2011 HOPE will be replaced by NEMO (with a 1.0-0.3 deg resolution, with initial conditions constructed with NEMOVAR). • The S3 uses a 159L62 old (31r1) version of the atmosphere model and the HOPE ocean model. In Q4-2011 the new S4, based on a more recent and higher-resolution 255L91 atmosphere model, and the NEMO ocean model will be introduced.
Conclusions Work will continue to further improve the ECMWF probabilistic forecasting systems in different areas: • Increase the vertical resolution – ECMWF is planning to increase the vertical resolution of the HRES/DA, EDA and EPS (~L95) systems (2012). Work to assess the impact on the EPS will start soon. • Improve the model error simulation schemes – Work is progressing to assess the impact of using the SPBS scheme in the EDA, and to investigate potential upgrades of the stochastic schemes in the EDA and EPS. • Further exploit the link between the EDA and the EPS – The use of initial-time land-surface and SST perturbations generated using the EDA is under investigation. Work to assess the potential value of using 25 or 50 EDA members will start soon. • Include a dynamical sea-ice model and a mixed-layer model – Work has started to assess whether using the LIM2/LIM3 dynamical sea-ice model and a mixed-layer model can lead to further improvements. • Increase the resolution of the ocean model and test coupling from d0 – Work will start soon to assess the impact of using a higher-resolution ocean model (1/4 degree NEMO) in the probabilistic forecasting systems. For the EPS, the possibility to couple from initial time will also be investigated.