Ongoing developments at ECMWF
Ongoing developments at ECMWF. Magdalena A. Balmaseda ECMWF, Reading, U.K. Overview. Progress in Seasonal Forecasting in past 10 years End to End Seasonal Forecasting System Progress in ENSO Prediction: model and initialization To do:


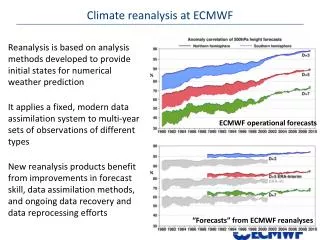
Ongoing developments at ECMWF
E N D
Presentation Transcript
Ongoing developments at ECMWF Magdalena A. Balmaseda ECMWF, Reading, U.K.
Overview • Progress in Seasonal Forecasting in past 10 years • End to End Seasonal Forecasting System • Progress in ENSO Prediction: model and initialization • To do: • Can we measure progress on precipitation due to calibration….? • Can users give feedback to the observation community? Which are the needs? • Ongoing developments at ECMWF • NEMO/NEMOVAR: big investment in infrastructure. • ERA-Interim: impact on Atlantic SST. Look at precipitation? • Exploring limits on forecast horizons: 1yr and beyond • Atmospheric model: Convection, WWB, resolution. • Time line for implementation • La Nina and impacts. Time for a Review focused on SA? • Calibration: • Some ideas on what to do next • Summary
End to End Forecasting System atmos obs atmos reanalysis initial conditions Reliable probability forecasts land,snow…? ensemble generation atmos DA AGCM Probabilistic forecast SST analysis calibration OGCM ocean DA initial conditions ocean reanalysis Tailored products sea-ice? ocean obs GCM integration FC calibration Initialization Ensemble Gen
Evolution of the ECMWF SF • Steady progress: ~1 month/decade skill gain • Dramatic change in coupled behaviour between S1 & S2: bias and variability • Improvement in S3, but still • Warm(est) bias in eastern Pacific • Underestimation of interannual variability S1 S2 S3
Contribution of Initialization and Model • For the prediction of ENSO-SST, it is possible to measure progress and to attribute improvements. • Is it possible with other variables? Should it be tried with the EUROBRISA System? • Is it possible to measure the impact of model/initialization and calibration? • In particular, it is important to determine the relevance of the calibration period. • It is important to give feedback to the wider community about the observational/reanalysis needs of forecast calibration.
Impact of observations (ocean and atmos) Impact on 1-7 month SF of SST
Example from the Medium Range Impact of Increased ensemble size versus longer calibration period (Continuous Rank Probability Skill Score, T-2m Europe) The longer calibration period has larger impact than increasing the ensemble size. From Hagerdorn 2008
On going developments at ECMWF Preparations for S4
The seasonal forecast System-3(implem. March 07) • COUPLED MODEL (IFS + OASIS2 + HOPE) • Recent cycle of atmospheric model (Cy31R1) • Atmospheric resolution TL159 and 62 levels • Time varying greenhouse gasses. • Includes ocean currents in wave model • INITIALIZATION • Includes bias correction in ocean assimilation. • Includes assimilation of salinity and altimeter data. • ERA-40 data used to initialize ocean and atmosphere in hindcasts • Ocean reanalysis back to 1959, using ENACT/ENSEMBLES ocean data • ENSEMBLE GENERATION • Extended range of back integrations: 11 members, 1981-2005. • Revised wind and SST perturbations. • Use EPS Singular Vector perturbations in atmospheric initial conditions. • Forecasts extended to 7 months (to 13 months 4x per year).
The seasonal forecast System-4(2010?) • COUPLED MODEL (IFS + OASIS3+ NEMO (ORCA1)) • Recent cycle of atmospheric model (Cy35R3 and beyond) • Atmospheric resolution TL159 (TL255?) and 62-(90?) levels • Time varying greenhouse gasses. • INITIALIZATION with NEMOVAR • Includes bias correction in ocean assimilation. • Includes assimilation of salinity and altimeter data. • ERA-40/ ERA-Interim data used to initialize ocean and atmosphere in hindcasts • Ocean reanalysis back to 1959, using EN3-XBt corrected ocean data • ENSEMBLE GENERATION • Wind, SST and Freshwater perturbations. • Perturbations to the sea-ice concentration during forecast. • Forecasts extended to 7 months (to 13 months 4x per year).
Impact of ERA-INTERIM • Era Interim is from 1989, continuously updated about 2 months behind real time • More up-to-date atmospheric model, increased resolution (from T159 in ERA-40 to T255), variational bias correction, 4D-var… See Uppala et al 2008, ECMWF Newsletter 115) • Large impact on hydrological cycle, winds, solar radiation… • Impact in the ocean is noticeable. It also affects the seasonal forecast skill • Should be used for verification (shortcoming: does not go back for a long enough period).
ERA-40 versus ERA-InterimCorrelation with Altimeter data Era-Interim improves the interannual variability of the ocean initial conditions, especially in the Equatorial and South-Tropical Atlantic ERA-40 ERA-INTERIM
ERA-40 versus ERA-Interim: Forecast Skill ERA-40 ERA-Interim Ocean Initial conditions prepared with ERA-Interim fluxes improve the forecast skill in the Equatorial Atlantic.
Onset of ENSO and MJO: All the SF systems failed to predict the amplification of El Nino 1997 from spring starts (April/May 1997). The reason: failure to generate a powerful WWB associated to an MJO event (already present in the initial conditions at the start of the integrations).
Analysis (hovmollers May-July 1997) Taux anom (c.i. 0.02 N/m2) Sea Level anom (c.i. 5cm) 1st May 1997 1st May 1997 SST anom (c.i. 0.5 deg) • WWB in July associated to an MJO event (alrady present at initial time) reach peak values ~0.2N/m2 around dateline. • They trigger a downwelling Kelvin wave. Peak values of SL anomalies in the Eastern Pacific reach 25 cm by mid June.. • SST anomalies reach maximum values of 4 deg in the Eastern Pacific by end of June-beg July 1st May 1997
Coupled FC (hovmollers May-July 1997) (S3) Taux anom (c.i. 0.02 N/m2) Sea Level anom (c.i. 5cm) 1st May 1997 1st May 1997 • In the Coupled forecasts the surface signature of the MJO dies after 20 days, there is not any propagation to the Pacific, and there is not any WWB. • As a consequence, the SL and SST anomalies of the coupled forecasts are those associated with the ocean initial conditions. • The El Nino fails to amplify. Peak SST values ~2 deg SST anom (c.i. 0.5 deg) 1st May 1997
New Atmospheric Cycles: S3 in red Changes in the parameterization of deep convection improve the representation of the MJO and he Onset of El Nino 1997. But this is not all the story, some other aspects get worse: too strong easterlies in the Eastern Pacific.
New Atmos cycles (33r1 versus S3) 33r1 S3 • The new cycles have colder bias (resulting from stronger easterlies) • There is too much variability in the Western Pacific, larger RMS error • The anomaly correlation is also degraded.
NEMO-CONTROLNEMO-ASSIMHOPE-ASSIM Impact of ocean model NEMO/NEMOVAR • NEMO has colder bias than HOPE in the Pacific, and larger variability => larger RMS error • NEMOVAR has impact on the drift • NEMOVAR improves correlation
NEMO-CONTROLNEMO-ASSIMHOPE-ASSIM Impact on Equatorial Atlantic NEMOVAR improves correlation in the Atlantic. Better than NEMO-CONTROL and HOPE-ASSIM It is the first time that Assimilation has a positive impact on the Atlantic Skill !!
Impact of Atmospheric Resolution Experimental Setup • Seasonal integrations for winters 1990/91-2005/06 • Atmosphere only with prescribed SST/sea ice • Resolutions: TL159, TL255 and TL511 (all 91 levels in the vertical) Courtesy of Thomas Joung
Mean Precipitation GPCP T511-GPCP T159-GPCP T511-T159 Courtesy of Thomas Joung
Winds @ 850 hPa T159-ERA40 T255-ERA40 T511-ERA40 • Increasing horizontal resolution beneficial for surface winds in the tropical Pacific. • TL255 might be enough to reduce the surface wind bias
EUROBRISA: some ideas • Paper on La Nina effects on SA • Work of optimality of historical hindcasts record. Also useful for decadal forecasting. • Can EUROBRISA detect the impact of the ocean observing system?. • How to get rid of the “negative” correlation in the calibrated product. See next slide. • 1) less weight to the statistical • 2) linear combination of “uncalibrated” + calibrated. [Penalty to account for the error in the calibration coefficients] • Work on temporal properties of the predictability: show when the calibration works best.
La Nina 2007-2008 The EUROSIP multimodel captured well the onset, amplitude and long duration of La Nina conditions. No individual model capture it correctely. How was the impact in precip over South America? How did EUROBRISA performed? Scope for a paper? Others: in Nino3 there were some misses. The calibrated plumes are slightly better: not misses, reduced spread
Multimodel: Raw versus calibrated Raw Bayesian
Curiosity: calibration versus multi-model EUROSIP ECWMF only (calibrated) For ENSO, ECMWF calibrated can beat the multi-model. This is not the case for the Atlantic. The calibration of the ECMWF is only a scaling factor of the interannual variance (as to match the observed variability)
Problems with Negative correlation ECMWF UKMO Meteo France CPTEC • None of the GCMs show large areas nor values of –ve correlation • The empirical shows large areas of –ve correlation • The calibrated shows large areas and large values of –ve correlation EMPIRICAL CALIBRATED Why? No robust calibration?
Temporal properties of Predictability 2m Temperature Amazones Predictability as a function of target month Anomaly Correlation Temperature Anomaly Correlation Precipitation Predictability as a function of initial conditions
Feb/March as a Window of predictability Target month is more predictable How the time-properties change in EUROBRISA? North-East Brasil Anomaly Correlation Temperature Anomaly Correlation Precipitation
Summary • Evidence that ENSO forecast is improving in time. Evidence of improved initialization. • Can the improvements be seen in the EUROBRISA system? • Need to assess the value of long hindcast calibrating records. • The ECMWF S4 will be ready in 2010. • It will be based on NEMOVAR • It will use ERA-Interim from 1989-onwards. Improvement in the Equatorial Atlantic • Probably improved Intraseasonal variability. • It is early times to assess performace • How to go on with EUROBRISA • Outstanding issue of no robust calibration (-ve skill in x-validation) • Explore/exploit the temporal features of prediction skill • Document performance of La Nina 2007-2008?