Download
1 / 54
540 likes | 751 Vues
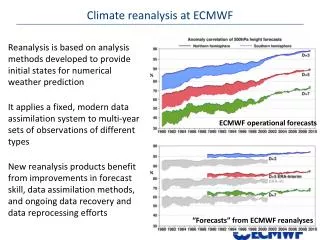
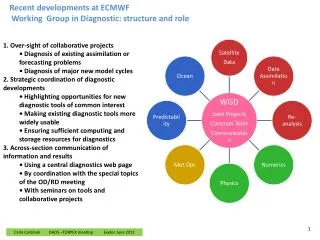
Introduction Forecast performance Recent changes and improvements Satellite data and the assimilation of precipitation and clouds. Recent developments at ECMWF Martin Miller (ECMWF) with input from several colleagues. Annual-mean r.m.s. errors against analyses from WMO scores.

E N D
Introduction Forecast performance Recent changes and improvements Satellite data and the assimilation of precipitation and clouds Recent developments at ECMWFMartin Miller(ECMWF) with input from several colleagues
Forecasting-system changes since 1997 N Hem Mean reduction in day-one error measured vs analyses in pre-operational trials S Hem
RemarksSubstantial recent improvement in deterministic forecasts, according to objective measures • Further reduction of the errors may come from: • High resolution (AIRS, IASI) satellite sounding data • Further increases in forecast system resolution • Assimilation of cloud and rain information • Targeted observations • Flow-dependent background error variances and co-variances
Convection and cloud changes in (Dec 2002)(CY25R4) • Cloud numerics and revised ice fall speed. • New algorithm for convection activation and cloud base/top. • Deep convection can be activated from any level up to 300 hPa from the surface (was from lowest model level only).
500 hPa Vertical motion (top, Pa/s) and 200 hPa horizontal wind (bottom) 2002051700+12 25R1 25R4
Effect of convection changes on ratio CP/LSP, 48 h fc, May 2002 25R1 25R4 conv prec L/S prec
USA (30-50N, 80-100W), 200 hPa: mean Z-increments Max divergence (*104) 25R1 In CY25R4, max divergence is reduced and Z200 increments are smaller 25R4
Time series of 850hPa wind RMS error for N-Amer, May 2002 (CY25R1 vs. CY25R4) Time series of 1000hPa height Anom. Corr. for Europe, May 2002 (CY25R1 vs. CY25R4) Improvement over N-Amer leads to lower frequency of bad forecasts over Europe.
Example of evolution of Z1000 fc errors up to 144 hours (20020507) 25R1 48 96 144 25R4 96 144 48
Model climateSW-ERBE 25R1 25R4
Zonal mean U-error (cnt: 1 m/s)Model JJA 1987 – ERA40 25R1 25R4
Evolution of forecast skill for northern and southern hemispheres
Recent satellite operational milestones • January 2002: • Use of QuikScat data • Modify thinning of ATOVS radiances • New fast RT model to compute radiances (much better for water vapour channels) • April 2002: • Use of water-vapour radiances from METEOSAT-7 • Use of SBUV (NOAA-16) and GOME (ERS-2) • Passive monitoring of water vapour radiances from GOES 8 and 10 • July 2002: • Passive monitoring of NOAA-17
New Observing-System Experiments Northern hemisphere Southern hemisphere Verification against control analysis
Three Strands of Ongoing Satellite Work • Use of Data from Operational Satellites • Use of GOES water vapour radiances • Use of NOAA-17 • Re-introduction of more HIRS channels in the system (16/17) • Introduction of AMSU-B radiances (15/16/17) • Preparation for AIRS, ENVISAT, EOS, CLOUDSAT and other research satellites • Introduction of MODIS polar winds • Assimilation for the Hydrological Cycle • Direct assimilation of radiances from SSM/I • Development of assimilation of cloud-affected and rain-affected radiances
Motivation - Space missions • The main space agencies are investing in a number of Earth-observation missions, aimed at all aspects of the Hydrological Cycle. • Atmospheric humidity, • troposphere (TOVS SSMI MSG AIRS IASI) • tropopause/stratosphere (ENVISAT WALES) • Clouds (MSG, CloudSAT, CALIPSO, EarthCARE) • Precipitation (SSMI(/S) AMSR TRMM GPM) • Soil moisture (SMOS)
Progress in precipitation and cloud assimilation at ECMWF An operational goal for 2004 Peter Bauer, Angela Benedetti, Frédéric Chevallier, Marta Janisková, Philippe Lopez, Jean-Jacques Morcrette, Emmanuel Moreau, Jean-Noël Thépaut and Adrian Tompkins
Assimilation of precipitation and cloud Obvious importance of clouds and precipitation Satellite data represent 95% of the data ingested into the ECMWF analysis system, but most of the satellite radiances (about 75 %) are not used because they are diagnosed as cloud- or rain-affected Assimilation of moist variables into NWPs challengingdue to the wide range of spatial and temporal scales State-of-the-art global NWP models describe cloud and precipitation with a reasonable degree of realism
Strategy toward operational 4DVAR cloud and precipitation assimilation • Model evaluation using currently available satellite measurements • Development of new and improved linearized physical schemes (cloud and convection) • Development of observational operators for moist observations (i.e. IR and microwave radiative transfer schemes, radar reflectivity models) • Use of retrieved productsanddirect measurements eg from TRMM to perform 1DVAR+4DVAR experiments • Direct 4DVAR assimilation
Simulating Satellite Channels (METEOSAT) Obs. Model 11 June 2002 15 UTC FC51 Chevallier et al, 2001, 2002
Model vs. Observed 19.35 GHz Tb, H pol Model SSM/I 7 January 2001 12 UTC
Model vs. HIRS 11 mwindow (K) HIRS 11m window (K) NOAA-11 01/1990 PM orbits (~14:00 LT) Obs ERA-40
Algorithms (2A12, PATER, Ferraro,...) Observed surface rainfall rates Closest point Box averaging Observations on model’s T511 Gaussian grid Ocean, T37V-T37H< 40 K and RRguess10-4 mm s-1 Ocean, RRguess>0 and RRobs0 Screening 1D-Var QC: |Ana-Obs|<3obs Marécal & Mahfouf (2002) TCWV pseudo-observations 4D-Var Assimilating observations related to precipitation: 2 methods TMI or SSM/I Microwave Brightness Temperatures
Model background T,qv 1D-Var analysis increments of T and qv Jacobians of convection & cloud scheme (Marécal & Mahfouf, 2002) Convection + Cloud scheme (PL, AT & MJ) TMI or SSMI retrieved rainfall rates simulated 3D rain and ql simulated surface rain Radiative Transfer Model (PBa) Adjoint of the RTM (EM) TMI or SSMI MW BTs (10,19,22,37 GHz) simulated MW Tb 1D-Var assimilation of TMI/SSMI brightness temperatures
2A12 obs 1D-Var/RR 2A12 1D-Var/BT PATER obs 1D-Var/RR PATER 1D-Var results Background Case of super-typhoon MITAG (5 March 2002 @1200 UTC) TMI data Surface rainfall rates (mm hr-1)
1D-Var results 1D-Var/RR 2A12 1D-Var/RR PATER 1D-Var/BT Case of super-typhoon MITAG (5 March 2002 @1200 UTC) Total Column Water Vapour increments (top , kg m-2) and mean profiles of temperature and specific humidity increments (bottom)
Case study I: Super-typhoon MITAG (5/3/02)Horizontal structure Radar reflectivity in dBZ (upscaled to model resolution) Radar reflectivity from first guess (dBZ) Model level 47 ~2km
Case study I: Super-typhoon MITAG (5/3/02) Horizontal structure Reflectivity from RR 1DVAR retrieval (dBZ) Reflectivity from BT 1DVAR retrieval (dBZ) Model level 47 ~2km
Case study I: Super-typhoon MITAG (5/3/02) Experiment with operational convection scheme First guess Obs BT analysis RR analysis
1DVAR on PATER surface RR Testing 1D-Var on precipitation profiles from TRMM radar Observation errors for TRMM/PR rain rates set to 50% RR. MITAG case: Cross-section of precipitation flux (mm hr-1) Background TRMM/PR 1DVAR on PR-RR
Tropical cyclone ZOE 26-31/12/02 GMS-5 SeaWIFS
1D-Var/BT 1D-Var results PATER obs 1D-Var/RR Background Case of tropical cyclone ZOE (26 December 2002 @1200 UTC) TMI data Surface rainfall rates (mm hr-1)
1D-Var results Background PATER obs 1D-Var/RR PATER 1D-Var/BT Ferraro obs 1D-Var/RR Ferraro Case of extra-tropical front (9 January 2002 @1200 UTC) SSM/I data Surface rainfall rates (mm hr-1)
Comparison of observed (top) and derived from model cloud fraction and cloud water (bottom) 35GHz reflectivity (Morcrette, 2002)
Cloud condensate time series (Log10 kg/kg)at the ARM -Tropical West Pacific site (September 2000) prognostic scheme new scheme diagnostic scheme
Large scale precipitation at the surface (mm/h)15 December 2000 12h fc t+12 (T159L60) • prognostic • scheme • new scheme • diagnostic scheme
Cloud 1Dvar assimilation experiments: realATOVS observations 15 March 2001 NOAA-15 First-guess vs. observations 1D-Var analysis vs. observations (log-linear contours) HIRS 11m (K) AMSU 50.3 GHz (K)
“Creation” of clouds using 1D-Var: simulated TOA and surface radiative fluxes Time series of cloud cover: no clouds in the first guess observed analysed Good performance of the 1D-Var Ability to create/remove clouds
Conclusions Current (and forthcoming) satellite instruments provide suitable information for cloud/rain assimilation in global NWP systems 4D-Var is a promising system for cloud/rain assimilation but there are difficulties associated with the scales and non-linearities of moist physics The assimilation of satellite radiances in cloudy and rainy systems has become the favoured option Impacts are still to be fully evaluated but are expected to be substantial where moist processes are critical
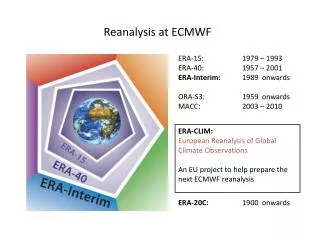
ERA-40 Planned Schedule Stream1 1987 - 2001 TOVS, SSM/I, ERS, ATOVS, CMW Stream2 1957 - 1972 Pre-satellite Stream3 1972 - 1988 VTPR, TOVS, CMW 2002 2003 2001 2000
CRU/Hadley Centre http:///www.cru.uea.co.uk/cru/info/warming Trends ERA-40