Download
1 / 20
200 likes | 400 Vues
FREE and EFFECTIVE Individualized Math Interventions. Presented by – Tasha Barker Director of Curriculum and Instruction Lindale ISD. Lindale ISD - Demographics. 3450 Students 80% White 9% African American 10% Hispanic 37% Economically Disadvantaged 4% ESL 5% Gifted and Talented

E N D
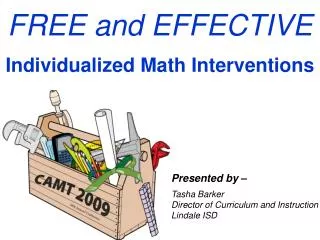
FREE and EFFECTIVEIndividualized Math Interventions Presented by – Tasha BarkerDirector of Curriculum and InstructionLindale ISD
Lindale ISD - Demographics • 3450 Students • 80% White • 9% African American • 10% Hispanic • 37% Economically Disadvantaged • 4% ESL • 5% Gifted and Talented • 11% Special Education
Lindale ISD – Math Performance • District • 2007 – 87% (Recognized Rating) • 2008 – 91% (Academically Acceptable Rating) • 2009 – 94% (Preliminary - Recognized Rating) • White (80%) – 95% • African American (9%) – 87% • Hispanic (10%) – 90% • Economically Disadvantaged (37%) – 91%
Lindale ISD – Math Performance • Velma Penny Elementary (Grades 3-4) • 2007 – 91% (Recognized Rating) • 2008 – 89% (Recognized Rating) • 2009 – 97% (Preliminary - Exemplary Rating) • White (78%) – 97% • African American (9%) – 98% • Hispanic (12%) – 93% • Economically Disadvantaged (42%) – 96%
Lindale ISD – Math Performance • E. J. Moss Intermediate (Grades 5-6) • 2007 – 96% (Recognized Rating) • 2008 – 96% (Recognized Rating) • 2009 – 98% (Preliminary - Exemplary Rating) • White (78%) – 99% • African American (10%) – 87% • Hispanic (10%) – 93% • Economically Disadvantaged (36%) – 94%
Lindale ISD – Math Performance • Lindale Junior High (Grades 7-8) • 2007 – 87% (Recognized Rating) • 2008 – 97% (Recognized Rating) • 2009 – 96% (Preliminary - Recognized Rating) • White (80%) – 97% • African American (8%) – 95% • Hispanic (10%) – 94% • Economically Disadvantaged (32%) – 92%
Lindale ISD – Math Performance • Lindale High School (4A) • 2007 – 79% (Academically Acceptable Rating) • 2008 – 86% (Recognized Rating) • 2009 – 87% (Preliminary – Exemplary Rating with TPM) • White (84%) – 89% • African American (8%) – 71% • Hispanic (6%) – 82% • Economically Disadvantaged (25%) – 80%
The Life of an Educator GPC NCLB R t I SSI AMI
What is the Researched-Based Requirement Referring to? • INSTRUCTIONAL • BESTPRACTICES • NOT • a Purchased Program
The Effective Math Intervention Journey A True Story
RESOURCES Access ALL of the Student Intervention Profiles @ http://www.lindaleeagles.org/index.pl?id=12205&isa=Category&op=show For Questions or Additional Information Contact Tasha Barker, Director of Curriculum and Instruction Lindale ISD 903-881-4000 barkerta@lind.sprnet.org