Download
1 / 36
360 likes | 490 Vues
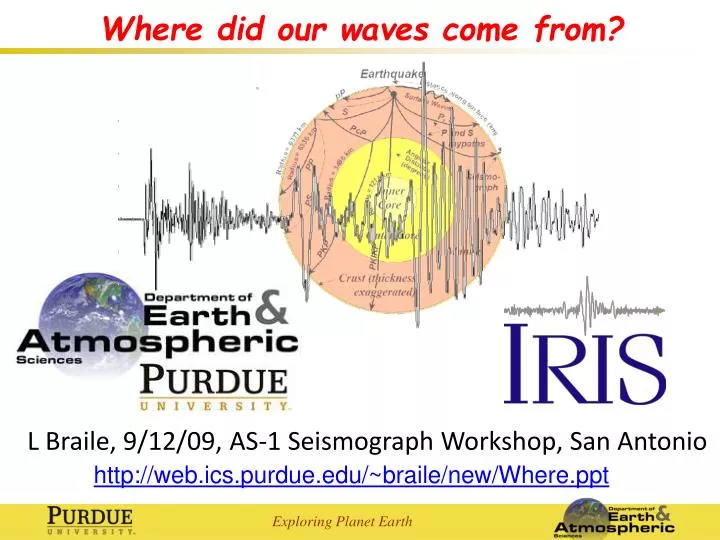
Where did our waves come from?. L Braile, 9/12/09, AS-1 Seismograph Workshop, San Antonio. http://web.ics.purdue.edu/~braile/new/Where.ppt. Exploring Planet Earth. Where did our waves come from?. 1. Where is source? a. Seismicity map b. Epicenter to station distance

E N D
Where did our waves come from? L Braile, 9/12/09, AS-1 Seismograph Workshop, San Antonio http://web.ics.purdue.edu/~braile/new/Where.ppt Exploring Planet Earth
Where did our waves come from? 1. Where is source? a. Seismicity map b. Epicenter to station distance c. Hypocenter information (latitude, longitude, depth, origin time), magnitude, damage/impact d. Accessing earthquake data: http://web.ics.purdue.edu/~braile/edumod/eqdata/eqdata.htm
Where did our waves come from? 2. How did the waves get to our seismograph? a. Earth structure b. Wave propagation through the Earth c. Seismic wave phases d. Seismic Waves software
1. Where is source? IRIS Seismic Monitor http://www.iris.edu/seismon/
IRIS Earthquake Browser http://www.iris.edu/servlet/eventserver/map.do
IRIS Seismographs in Schools Interactive Earthquake Map http://www.iris.edu/hq/ssn/events
Displaying earthquake epicenters using Google Earth http://neic.usgs.gov/neis/epic/kml/ http://neic.usgs.gov/neis/epic/epic_global.html (USGS earthquake search)
USGS Earthquake Site http://earthquake.usgs.gov/
USGS M5+ Recent Earthquake List http://earthquake.usgs.gov/eqcenter/recenteqsww/Quakes/quakes_big.php
USGS Earthquake Search http://neic.usgs.gov/neis/epic/epic.html
IRIS Event Search http://www.iris.edu/quakes/eventsrch.htm
2. How did the waves get to our seismograph? Earth Structure and Properties
Seismic Wave Propagation (slinky, human wave demo, seismic wave animations, seismograms, seismic waves software) http://web.ics.purdue.edu/~braile/new/SeismicWaves.ppt
Refraction Refraction PKP
Epicenter Plotting – year long activity – map practice that engages students in global earthquake activity
Seismograms recorded by your seismograph from locations around the world
Using the Seismic Eruption Software… Seismic-Eruption software (Free!, Windows)Introduction and NavigationCalifornia EarthquakesSo. California EarthquakesFrequency-Magnitude Analysis - CaliforniaNorthridge Earthquake (map, cross section)Aftershocks (Denali, Landers) The Seismic Eruption software: http://bingweb.binghamton.edu/~ajones/ Exploring Planet Earth
The Seismic Waves program From Alan Jones, SUNY, Binghamton http://bingweb.binghamton.edu/~ajones/
The Seismic Waves program: Uses speeded-up time views of wavefronts to illustrate wave propagation through the Earth. Note reflection, refraction and wave conversion at layer boundaries. Seismograms show arrivals of various phases (wave types and paths). Wave energy/propagation represented by wavefronts. Raypaths show direction of travel of a specific point on the wavefront. Earthquake * Cross Section Through Earth Wavefront Ray Path Stations for Seismograms Seismograph Ray Path is perpendicular to wavefront
Practice/Demonstation:The Seismic Waves Program Earthquake * Cross Section Through Earth Wavefront Ray Path Stations for Seismograms Seismograph Ray Path is perpendicular to wavefront
You can add views to the Seismic Waves Program for “your” seismogram and other AS-1 (or other) stations. Example: M6.0 February 21, 2008 Wells, Nevada earthquake. For this event, we have five AS-1 seismograms recorded by IRIS Seismograph in Schools stations! Earthquake * Cross Section Through Earth Wavefront Ray Path Stations for Seismograms Seismograph Ray Path is perpendicular to wavefront
Procedure: 1. In AmaSeis, navigate to the selected event. Navigation can be performed with the Go To Date-Time… tool in the Settings menu, or with the Forward/Backward control (see below) opened by clicking on the green arrows on the toolbar, or by scrolling. (You can also download other seismograms in sac format for Seismic Waves from the IRIS DMC using Bud/Wilber - http://www.iris.edu/data/request.htm. ) Green Arrows Forward/Backward toolbar
2.Extract the seismogram and save as a sac file (Sac is standard file format that is used by AmaSeis). Use the standard SIS naming convention (yymodahrmnNAME.sac).
3. Open the Event… dialog box under the Settings menu. A. Enter the event name (use the same event name for all seismograms that will be included in the Seismic Waves view). B. Enter the earthquake magnitude and, C. the earthquake origin time and location. A. B. C.
4. Click OK in the EventDialog box and the seismogram will display additional information (earthquake location and magnitude and epicenter to station distance in degrees).
5. Open the EventDialog box again and click on Create files for Seismic Waves to add the seismogram to a folder in the SW (Seismic Waves) folder. You can add several seismograms from different stations for the same earthquake. For our Wells, Nevada example, the folder is labeled 2008022114 (see below for path), the date and hour of the event. Five seismograms have been added to this folder.
6. When you finish adding data to the seismogram folder for your event (for example, the 2008022114 folder for the Wells, Nevada earthquake data), an event file will have been created in the SW folder (2008022114.evt in our example, below). Double click on the folder to open in Notepad. The evt file will have only one STATIONFILE listed. Add the additional STATIONFILES lines to the list (as below) and save.
7. You can also change the TIMEACCELERATION and TIMEWINDOW settings (or others) in the evt file if desired (see settings below chosen for the Wells, Nevada earthquake seismograms). Save the evt file.
8. You are now ready to open Seismic Waves and run the program for your event with the added seismograms. The results for the Wells, Nevada earthquake seismograms are shown on the next two slides. The seismograms for our example are listed below. Click on the links to download the sac files and place in your AmaSeis folder (create a folder called SacFiles for your individual seismograms). You can open the seismograms in AmaSeis and then export to Seismic Waves using the Create files for Seismic Waves selection in the EventDialog box and you will be ready to view in Seismic Waves. http://web.ics.purdue.edu/~braile/new/0802211417AZAZ.sac http://web.ics.purdue.edu/~braile/new/0802211418PCAZ.sac http://web.ics.purdue.edu/~braile/new/0802211418UPOR.sac http://web.ics.purdue.edu/~braile/new/0802211421NLNC.sac http://web.ics.purdue.edu/~braile/new/0802211421WLIN.sac
The Seismic Waves program showing events that can be viewed, including the Wells, Nevada earthquake
The Seismic Waves program showing the Wells, Nevada earthquake seismograms from the AS-1 stations. The view includes Earth surface, Earth cross section and seismograms.
M6.0, February 21, 2008 Wells, Nevada earthquake shown by large red star. S-P circles (from S-P times from seismograms analyzed using AmaSeis for stations PCAZ, UPOR, WLIN and NLNC – red triangles). -130 -120 -110 -100 -90 -80 -70 50 50 40 40 30 30 M4+ earthquakes, 1980-2009 (Sept. 15); about 35,000 events. 20 20 -130 -120 -110 -100 -90 -80 -70
Input information (left) for Wells, Nevada earthquake and location and S-P inferred distances (radius in km) for seismograph stations PCAZ, NLNC, UPOR, and WLIN. Legend (depth of focus scale and magnitude and data source table) for the seismicity map on previous slide. Map produced with IRIS event search tool: http://www.iris.edu/quakes/eventsrch.htm