Download
1 / 22
220 likes | 245 Vues
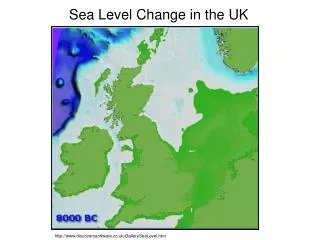
Sea Level Change in the Russian Sector of the Arctic Ocean. Andrey Proshutinsky and Richard Krishfield Woods Hole Oceanographic Institution, USA Igor Ashik and Evgenii Dvorkin Arctic and Antarctic Research Institute, Russia Sirpa Hakkinen Goddard Space Flight Center, USA and

E N D
Sea Level Change in the Russian Sector of the Arctic Ocean Andrey Proshutinsky and Richard Krishfield Woods Hole Oceanographic Institution, USA Igor Ashik and Evgenii Dvorkin Arctic and Antarctic Research Institute, Russia Sirpa Hakkinen Goddard Space Flight Center, USA and Richard Peltier University of Toronto, Canada This material is based upon work supported by the National Science Foundation under Grant No. 0136432
Motivation and goals Sea level is a natural integral indicator of climate variability. It reflects changes in practically all dynamic and thermodynamic processes of terrestrial, oceanic, atmospheric, and cryospheric origin. But use of estimates of sea level rise as an indicator of climate change incurs some difficulties because the observed sea level change is the net result of many individual effects of environmental forcing. Since some of these effects may offset others, the cause of the sea level response to climate change remains somewhat uncertain. This talk is focused on an attempt to provide first order answers to two questions, namely: • What is the rate of sea level change in the Arctic Ocean? • What is the role of each of the individual contributing factors to observed Arctic Ocean sea level change?
Sea Level data sources Monthly mean relative sea levels were provided by the Arctic and Antarctic Research Institute for 71 stations (see station numbers) located in the Barents and Siberian Seas. The time series of sea level variability generally cover the period between 1948 and 2000 but temporal coverage differs significantly from station to station. Red denotes stations with the most complete datasets.
Sea Level data sources Kara Sea Coastal stations Island stations Stations influenced by river runoff Interannual variability Seasonal changes
Sea Level data sources Laptev Sea Coastal stations Island stations Stations influenced by river runoff Interannual variability Seasonal changes
Sea Level data sources East-Siberian and Chukchi Seas Coastal stations Island stations Stations influenced by river runoff Interannual variability Seasonal changes
Long-term variability Figure shows a mean sea level curve (thick blue line) for all regions. Sea level correlates very well with the North Atlantic Oscillation index (red solid line) after about 1963. After 1990 the sea level behavior differs significantly among regions, and this is most probably because the number of stations (yellow bars show an average number of stations used in each region) available for data averaging decreases significantly. Many observational programs in the Arctic were interrupted after 1989. Long-term trend of sea level rise is approximately 0.08 cm/year.
Observed sea level trends, cm/yearRedandbluecolors show positive and negative trends, respectively
Sea Level Trends, cm/year Sea level trends differ significantly from station to station and from region to region. This is probably because different factors influence sea level trends locally.
Factors influencing sea level variability • Geological effects • Changes in sea level atmospheric pressure • Winds • Precipitation and evaporation • River runoff • Steric effects (changes in the water temperature and salinity)
1. Glacial isostatic adjustment The ongoing Glacial Isostatic Adjustment (GIA) process due to the deglaciation of the northern hemisphere continents commenced approximately 21,000 year ago and ended approximately 4,000 years ago. The process continues to exert a highly significant influence on modern tide gauge measurements of secular sea level trends (eg. Peltier, 1986; Peltier and Tushingham, 1989, 1991). Figure shows rates of the secular sea level change due to GIA as predicted by the Peltier’s (2002) model Ice-4G (VM2).
Sea Level Trends corrected for GIA, cm/year However, the ICE-4G model of glaciations history is significantly in error to the east of Novaya Zemlya. This has been demonstrated by the members of the EU sponsored QUEEN project (e.g. Mangerud et al., 2002). The elimination of the heavy ice cover over the Kara Sea sector of the ICE-5G model, together with the additional modifications over the Barents Sea, significantly reduces the predicted rates of relative sea level fall due to GIA on the tide gauges from these regions, thereby leading to much enhanced uniformity of the secular rates of relative sea level rise across all of the Arctic coastal regions from which data are available.
Role of sea level atmospheric pressure variability or inverted barometer effect
Sea level atmospheric pressure (SLP) trend (inverted barometer effect) Corrections for SLP variations are known to be essential for studies of seasonal and interannual variability of mean sea level, although it has only recently (IPCC, 2001) been pointed out that these changes are important for analysis of secular changes in sea level because their long-term trends are noticeable. For the Arctic conditions where variability in sea level atmospheric pressure is substantial this factor is very important. The effect of this continuing sea level pressure fall (Figure) is responsible to some degree for the sea level rise over the Arctic Ocean.
Sea level trends from model results In order to assess the role of wind and several other factors we have employed a 2-D barotropic coupled ice-ocean model. This model takes into account wind effects, sea ice influence, the inverted barometer effect, variable river discharge and variable inflow of the Pacific waters through Bering Strait. It does not take into account changes in sea level associated with changes in ocean temperature and salinity (steric effects).
Sea level trend associated with precipitation minus evaporation trend In order to assess the role of the change in P-E, we ran the 2-D model under the influence of P-E forcing only (without wind stresses, inverted barometer effect, and river runoff). All of the open boundaries of the model had a radiation boundary condition prescribed. Figure shows sea level trends associated with P-E for the period 1954-1989. For the coastal regions of the Siberian seas, this trend is negative and on average is approximately 0.002 cm/ year (one order of magnitude smaller than the trends due to wind forcing and the inverted barometer effect.
Role of river discharge Sea level increases significantly in June-July at river mouth stations. But the direct effect of river runoff (effect associated with the increase of water volume in the ocean) at interannual and longer-term scales is relatively small. The sea level trend associated with this river inflow in terms of the barotropic effect is positive but very small.
Role of steric effect Steric effects were investigated using a 3-D coupled ice-ocean model (Hakkinen and Mellor, 1992). The model predicts a sea level rise in the coastal regions and a sea level fall in the Nansen and Amundsen basins. This is probably related to the increase of advection of Atlantic Water with a relatively high salinity into the area after the 1980s. Positive trends in sea level over shelves are the result of a redistribution of river runoff due to an increase of the cyclonic winds in the 1990s.
Comparing with model results The dashed blue line shows sea level variability as reproduced at the coastal stations by our 3-D model (without the inverted barometer effect) and the dotted blue line shows mean sea level variability associated with the inverted barometer effect only. The 3-D model reproduces observed sea level very well but underestimates the range of variability. The same can be said about the inverted barometer effect and both model results (3-D model plus inverted barometer effect) oscillate in phase with the observed sea level curve, but overestimate sea level rise during the last 10 years. On the other hand, the observational data subsequent to 1989 is of inadequate quality and therefore cannot be employed for robust evaluation of model performance.
Conclusions Answering two major questions formulated for this study: • What is the rate of sea level change in the Arctic Ocean? • What is the role of each of the individual contributing factors to observed Arctic Ocean sea level change? we have discovered that during the period 1954-1989 the observed sea level is rising over the Arctic Ocean at a rate of approximately 0.123 cm/year and that after correction for the process of glacial isostatic adjustment this rate is approximately 0.185 cm/ year. There are two major causes of this rise. • The first is associated with the steric effect of ocean expansion. This effect is responsible for a contribution of approximately 0.064 cm/ year to the total rate of rise (35%).
Conclusions (cont. 1) • The second most important factor is related to the ongoing decrease of sea level atmospheric pressure over the Arctic Ocean which contributes 0.056 cm/year, or approximately 30% of the net positive sea level trend. • The combined effect of the sea level rise due to an increase of river runoff and the sea level fall due to a negative trend in precipitation minus evaporation over the ocean is close to 0. • For the Russian sector of the Arctic Ocean it therefore appears that approximately 25% of the trend of 0.185 cm/year, a contribution of 0.048 cm/year, may be due to the eustatic effect of increasing Arctic Ocean mass.
QUESTIONS ? QUESTIONS?