Download
1 / 32
320 likes | 493 Vues
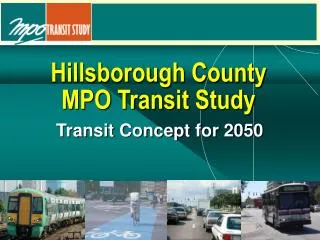
Hillsborough County MPO Transit Study. Transit Concept for 2050. Transit Concept for 2050. Basis of Concept Improve Mobility Support Economic Vitality Quality of Life and Growth Management Transit Service Characteristics Major Destinations Quality of Service Service Area.

E N D
Hillsborough County MPO Transit Study Transit Concept for 2050
Transit Concept for 2050 Basis of Concept • Improve Mobility • Support Economic Vitality • Quality of Life and Growth Management Transit Service Characteristics • Major Destinations • Quality of Service • Service Area
Future Commute • Total miles of travel would double by 2050 • Average delay on trips would triple • Rail transit provides reliable trip times that don’t change • Bus transit can also do this in exclusive or special purpose lanes
Hillsborough County MPO Transit Study • Adopted by the MPO 11/06/07 • To be incorporated into the analysis for the LRTP update and the TBARTA Master Plan Transit Concept for 2050
Bus • Standard or articulated high-capacity vehicles • Special lanes or signal priority – Bus Rapid Transit • Advantage of flexible service • Congestion problem in mixed traffic Capacity of about one new arterial lane
Light Rail • Powered from above • Has its own tracks • Frequent all day service • Suburb-to-city and urban area travel • Quick acceleration • Can climb and turn easily Capacity of about four new arterial lanes
Commuter Rail • Locomotive pulling passenger cars • Can share freight tracks • Flexible capacity • Peak hour service • Long haul or suburb-to-city • Needs to run flat and straight Capacity of about one new lane of Interstate
Concept Selection Process • Identified best opportunities for transit corridors • Past studies • Future concepts • Determined projected growth • Compared concept with current trend for 2050 • Created a transit oriented future scenario • Evaluated technology choices • Capacity of transit corridors to accommodate development • Potential ridership and order of magnitude costs
Light Rail • New Tampa-Westshore • Brandon-Westchase • South Tampa-Downtown Commuter Rail • Lutz • SouthShore • Plant City Bus • Complementary Bus Network USF Westshore Downtown Tampa Brandon South Shore
USF • Connects major activity centers • Continuous all-day service • Closely spaced station • 30 miles • 26 Stations • Serves urban living, transit dependent, choice riders & special event • Capacity to support future growth Westshore Downtown Tampa Red Line (Light Rail):New Tampa/ USF – Westshore
Westchase • Connects housing & employment • Brandon as regional center • Infill east of CBD • Closely spaced station • 27 miles • 27 Stations • Serves urban living, transit dependent, choice riders & special events Downtown Tampa Brandon Blue Line (Light Rail):Westchase – Brandon
Green Line (Light Rail):South Tampa – Downtown Tampa • Serves densely populated area & activity centers • Closely spaced stations • 8 miles • 9 Stations • Serves urban living, transit dependent, choice riders & special events Downtown Tampa MacDill
Lutz USF • Commuter rail service to north Hillsborough & Pasco County • Peak period travel & transfer stations to light rail • Express service • 17 miles • 6 Stations • Provides alternative to commuters, transit dependent & underserved areas • Adds capacity alternatives to major road investments Downtown Tampa Magenta Line(Commuter Rail):Lutz – Downtown Tampa
Plant City • Commuter rail service to Plant City, Brandon & Polk County • Peak period travel & transfer stations to Brandon light rail • Express service • 26 miles • 5 Stations • Provides alternatives for commuters, transit dependent & underserved areas • Adds capacity alternatives to major road investments Downtown Tampa Brandon Purple Line(Commuter Rail):Plant City/Brandon – Downtown Tampa
Commuter rail service to SouthShore and Sarasota/Manatee counties • Peak period travel & transfer stations to light rail • Express service • 26 miles • 7 Stations • Provides alternative to commuters, transit dependent & underserved areas • Adds capacity alternatives to major road investments Downtown Tampa Orange Line(Commuter Rail):SouthShore – Downtown Tampa SouthShore
Plant City • Commuter rail service to Plant City along I-4 & East Central Florida • Peak period travel to Tampa • Express service • 26 miles • 5 Stations • Provides alternative to commuters, transit dependent & underserved areas • Adds capacity alternatives to major highway investments Downtown Red Line (Commuter/Regional Rail):Plant City/ I-4 – Downtown Tampa
Transit Concept Characteristics Light Rail(average 1 mile station spacing) • New Tampa-Westshore (Red Line) 30 miles 26 stations • Brandon-Westchase (Blue Line) 27 miles 27 stations • South Tampa-Downtown (Green Line) 8 miles 9 stations Commuter Rail (average 3 - 5 mile station spacing) • Lutz (Magenta Line) 17 miles 6 stations • SouthShore (Orange Line) 26 miles 7 stations • Plant City/Brandon (Purple Line) 26 miles 5 stations • Plant City/I-4 (Red Line) 26 miles 5 stations
Denver Comparison Hillsborough County • Light Rail • 65 miles and 62 stations • Commuter Rail • 95 miles and 23 stations Denver • Light Rail • 72 miles and 65 stations • Commuter Rail • 80 miles and 20 stations Denver
Station Types Regional 50-100 DU/Ac 30-500 Jobs/Ac Community 20-75 DU/Ac 5-100 Jobs/Ac Neighborhood 10-50 DU/Ac 2-15 Jobs/Ac
HH Density Current < 2 2 - 4 4 - 8 8 - 16 > 16 DU/Acre (2000)
HH Density Transit Concept < 2 2 - 4 4– 8 8 – 16 > 16 DU/Acre (2050) Projected Total With Transit
Jobs Density Current < 1 1 - 5 5 – 25 25 – 50 > 50 Jobs/Acre (2000)
Jobs Density Transit Concept < 1 1 - 5 5 - 25 25 - 50 > 50 Jobs/Acre (2050) Projected Total With Transit
% of Total Households & Jobs Within Station Areas for 2050 2050 Total • 34% of Households • 49% of Jobs Can be accommodated within 1 mile of stations
Potential Transit Ridership * These estimates do not include ridership to and from Pinellas County.
Capital Cost Summary This table estimates the capital cost for the Transit Concept for 2050 based on 2007 dollars.
Operating & MaintenanceCost Summary This table estimates the operating/maintenance cost for the Transit Concept for 2050 based on 2007 dollars.
Next Steps • MPO adoption on 11/06/07 - Done • Incorporate into analysis for the LRTP update • Offer input to the TBARTA plan