Collaborators:
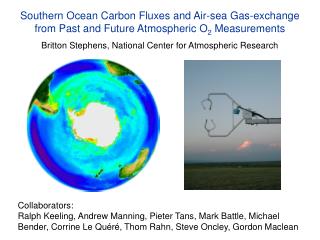
Southern Ocean Carbon Fluxes and Air-sea Gas-exchange from Past and Future Atmospheric O 2 Measurements Britton Stephens, National Center for Atmospheric Research. Collaborators:

Collaborators:
E N D
Presentation Transcript
Southern Ocean Carbon Fluxes and Air-sea Gas-exchange from Past and Future Atmospheric O2 Measurements Britton Stephens, National Center for Atmospheric Research Collaborators: Ralph Keeling, Andrew Manning, Pieter Tans, Mark Battle, Michael Bender, Corrine Le Quéré, Thom Rahn, Steve Oncley, Gordon Maclean
Atmospheric O2 Applications • Global terrestrial/oceanic carbon budget partitioning • Seasonal hemispheric ocean productivity • Seasonal hemispheric gas-exchange rates • North-south ocean and atmosphere transport • Terrestrial ecosystem dynamics • Fossil-fuel CO2 source characterization • Continental air origins and boundary-layer venting • Thermal vs. biological ocean carbon flux partitioning • Direct eddy-covariance O2 fluxes
Annual mean TransCom3 results Takahashi 2002 x Wanninkhof 1992 Gurney et al, Nature, 2002 TransCom3 Southern Ocean a priori values and data Gurney et al., 2002 (-0.58) Takahashi et al., 2002 (-0.58) Rödenbeck et al., 2003 (+0.25) Roy et al., 2003 (-0.3) Jacobson et al., 2005 (-0.15)
Solubility Pump Biological Pump The Southern Ocean will play a key role in future anthropogenic CO2 uptake, mediated by strong opposing solubility and biological influences 2056-65 Global Warming Simulation [Sarmiento et al., Nature 1998 ]
Solubility (thermal) and biological processes have discernable effects on atmospheric O2 and CO2
“CMDL Gradient” = (TDF+PSA+HBA+SYO+CRZ)/5 - (EIC+SPO+CGO)/3 “SIO Gradient” = PSA – (CGO+SPO)/2 “PU Gradient” = SYO – (CGO+AMS)/2 CRZ PSA HBA SYO TDF AMS SPO EIC CGO SeaWiFS Summer Chlorophyll a SeaWiFS Winter Chlorophyll a
O2 Gradients CO2 Gradients CO2 Gradients ppm or mol/m2/yr -3 -2 -1 0 1 per meg or mol/m2/yr -30 -20 -10 0 10 20 30 ppm or mol/m2/yr -3 -2 -1 0 1 0 0.2 0.4 0.6 0.8 1.0 Year fraction 0 0.2 0.4 0.6 0.8 1.0 Year fraction 0 0.2 0.4 0.6 0.8 1.0 Year fraction Red = CMDL: (TDF+PSA+HBA+SYO+CRZ)/5 - (EIC+SPO+CGO)/3 Green = SIO: PSA - (CGO+SPO)/2 Blue = Climatology S of 40 S (Takahashi 2002 or Keeling and Garcia 2001 + Gruber 2001) Black = OCMIP2 Models S of 40 S Purple = PU: SYO – (CGO+AMS)/2
O2:CO2 Ratios CO2 Gradients O2:CO2 Ratios O2 Gradients ppm -3 -2 -1 0 1 -30 -20 -10 0 10 20 30 per meg -30 -20 -10 0 10 20 30 -30 -20 -10 0 10 20 30 0 0.2 0.4 0.6 0.8 1.0 Year fraction 0 0.2 0.4 0.6 0.8 1.0 Year fraction 0 0.2 0.4 0.6 0.8 1.0 Year fraction approximate annual-mean differences CO2 O2 SIO: PSA – (CGO + SPO)/2 +0.07 -5.0 PU: SYO – (CGO + AMS)/2 +0.16 +4.7 Red = CMDL: (TDF+PSA+HBA+SYO+CRZ)/5 - (EIC+SPO+CGO)/3 Green = SIO: PSA - (CGO+SPO)/2 Blue = Climatology S of 40 S (Takahashi 2002 or Keeling and Garcia 2001 + Gruber 2001) Black = OCMIP2 Models S of 40 S Purple = PU: SYO – (CGO+AMS)/2
“SIO Gradient” = PSA – (CGO+SPO)/2 “PU Gradient” = SYO – (CGO+AMS)/2 CRZ PSA HBA SYO TDF AMS SPO EIC CGO SeaWiFS Summer Chlorophyll a SeaWiFS Winter Chlorophyll a
O2:CO2 ratios from 4-sample (~ 2 month) fits (screening for R2 > 0.3)
O2:CO2 ratios from 4-sample (~ 2 month) fits (screening for R2 > 0.3)
Conclusions (part 1) • There is a clear atmospheric signature of wintertime Southern Ocean CO2 outgassing and approximate annual-mean CO2 flux balance. • Atmospheric O2:CO2 ratios suggest a dominant biological influence on CO2 fluxes year-round. • Small Southern Ocean atmospheric gradients are useful in evaluating pCO2 climatologies and the OCMIP2 models. • Incorporate existing and future winter pCO2 measurements • Continue to evaluate OCMIP2 model physics, and evaluate more sophisticated models
New constraints on air-sea gas-exchange [Figure courtesy W. McGillis] FCO2 = k S (pCO2w – pCO2a)
Deployed at Jefferson County Airport, Colorado VUV Absorption O2 Instrument Differential precision: 2 per meg (0.4 ppm) rms in 4 seconds Short term precision: 2 per meg (0.4 ppm) rms in 1 second Fundamental response time: ~ 100 Hz
Power spectrum of VUV Signal per meg LI7000
Early evening respiration signal Cospectra with vertical wind Cross correlation with vertical wind Lag f (Hz) Red: CO2 Blue: H2O Green: O2
O2 fluxes are generally larger than CO2 fluxes Upper range of HAMOCC3.1 fluxes (mol/m2/year)
Conclusions (part 2) • Preliminary tests suggest that the VUV instrument may be capable of measuring O2 fluxes by eddy-correlation. • This would enable a new constraint on air-sea gas-exchange rates and their solubility dependence. • Drying air to a few ppm H2O while maintaining turbulent flow through inlet tubes is the primary challenge.
Large model differences in the Southern Ocean Simulated 1995 cumulative CO2 fluxes and inventory