Water Potential
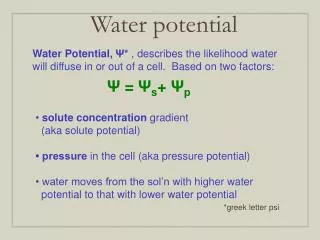
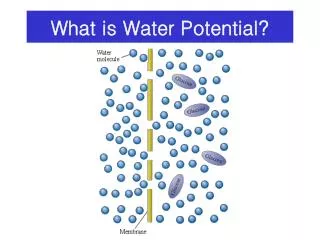
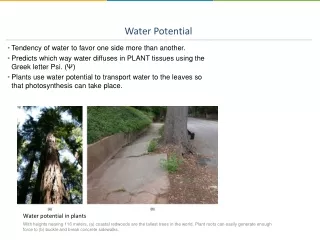
Water Potential. What is Water Potential Read paragraph 2. Term used by botanists when predicting the movement of water into or out of plant cells (walled; have more pressure differences) Has two components: Pressure potential ( Y p): The physical pressure component of system.

Water Potential
E N D
Presentation Transcript
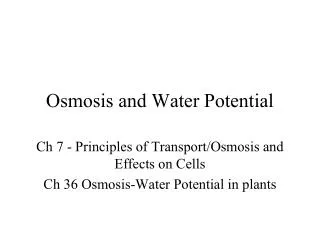
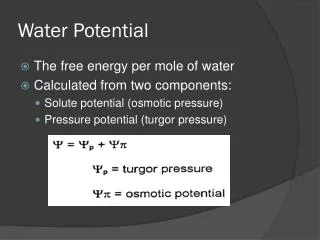
What is Water PotentialRead paragraph 2 Term used by botanists when predicting the movement of water into or out of plant cells (walled; have more pressure differences) Has two components: • Pressure potential (Yp): The physical pressure component of system. • Solute potential (Ys): The effect of solute concentration on system.
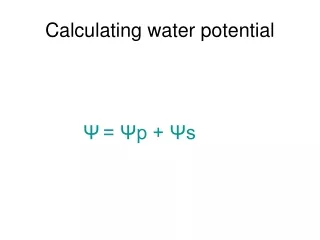
Calculating water potential (Y) • = Yp + Ys Water Potential = pressure pot. + solute pot.
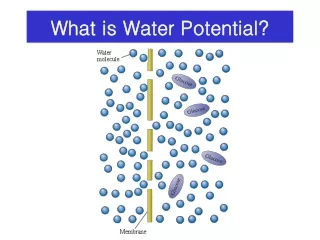
Understanding Water Potential(read paragraphs 3 &4) Water will always move from High Y to low Y! Pure water in an open system at atmospheric pressure has a Yp = 0 This makes Y = Ys
Understanding Water Potential(read paragraph 7) Ys is always negative. Pure water Y= 0, therefore adding solute lowers Y (more negative) Draw cell in solution to compare Y in two different areas. Will always assume that solute is NOT diffusing !
Purpose • We will determine the water potential of russet potatoes, Yukon gold potatoes, Yams, and carrots by measuring their sucrose(solute) concentrations to see if they differ. • Hypothesis:
Lab Report Intro: • Purpose • Hypothesis Results: • Graph Average % Change in mass for potatoes • Data Table for average sucrose molarities of each potato, and calculated Y. Conclusion: • Hypo supp/rej • Data to justify this • Questions 7,8,9 (hand written)