
Exploring Human Migration: Patterns, Causes, and Impacts
E N D
Presentation Transcript
Chapter 3: Migration The Cultural Landscape: An Introduction to Human Geography
Migration • Migration is a type of mobility • Migration is a permanent move to a new location • Migration is a specific type of relocation diffusion, which is the bodily mov’t of people from one place to another. • Emigration • Migration from a location • Immigration • Migration to a location • Net Migration = Immigrants – Emigrants • Thus, if Immigrants exceed Emigrants, this is positive (Net in-migration)
Migration • Migration A change in residence that is intended to be permanent. • Emigration-leaving a country. • Immigration-entering a country. Picture of Little Haiti, Miami, Florida
On average, Americans move once every 6 years. • US population is the most mobile in the world with over 5 million moving from 1 state to another every year. • 35 million move within a state, county or community each year. • The changing scale generated by modern transportation systems (cars, airplanes) makes relocation diffusion more feasible than in the past. • Migration a key factor in the speed of diffusion of ideas and innovation. • Migration of people with similar cultural values creates pockets of local diversity.
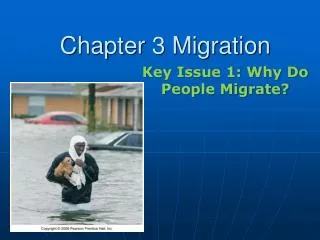
Reasons for migration • People decide to migrate b/c of push & pull factors • Push factor—induces people to move out of their present location. • Pull factor—induces people to move to a new location. • 3 kinds of push/pull factors—economic, cultural, & environmental • Most people migrate for economic reasons • People emigrate from places with few economic opportunities & immigrate to places where jobs seem available.
Economic Conditions – Migrants will often risk their lives in hopes of economic opportunities that will enable them to send money home (remittances) to their family members who remain behind.
Economic Opportunities In late 1800s and early 1900s, Chinese migrated throughout Southeast Asia to work in trade, commerce, and finance.
Environmental Conditions –In Montserrat, a 1995 volcano made the southern half of the island, including the capital city of Plymouth, uninhabitable. People who remained migrated to the north or to the U.S.
Reasons for Migration • Cultural and environmental factors also induce migration, just not as frequently as economic factors • Cultural factors • Forced migration • Slavery:18th& 19th centuries to Western Hemisphere from Africa • Refugees: People forced to migrate & cannot return b/c of fear of persecution b/c of race, religion, or political opinion. • Political factors • People may be pulled to democratic countries. • 1940s—Communists tried to stop emigration (i.e. Berlin Wall) • Environmental factors • People are pulled to physically attractive regions. These include mountains, seasides, and warmer climates. • People are often pushed from their homes b/c of water-related disasters (New Orleans) or a lack of water (Sahel desert in Africa)
From 12 to 30 million Africans were forced from their homelands in the 18th century. It took generations to restore the population balance.
Catalysts of Migration • Economic conditions-poverty and a desire for opportunity. • Political conditions-persecution, expulsion, or war. • Environmental conditions-crop failures, floods, drought, environmentally induced famine. • Culture and tradition-threatened by change. • Technology-easier and cheaper transport or change in livability.
Refugees: Sources and Destinations Figure 3-2
Intervening Obstacles • Definition—Environmental or cultural feature that hinders migration. • In the past, these were mostly environmental. Example: Many Europeans spent their entire life’s savings trying to cross the Atlantic to get to America b/c they truly believed the streets were paved w/ gold. • Improved technology (airplanes, cars) have diminished environmental intervening obstacles. Today’s migrants face obstacles created by local diversity in gov’t and politics (i.e. need a Passport)
Study of Migration • E. G. Ravenstein (19th century geographer) • His “laws” can be organized into 3 groups • The reasons why migrants move • The distance they typically move • The characteristics of their move • His theories made 2 main points about distance that migrants travel to their new homes: • Most migrants relocate a short distance and remain w/in same country. • Long-distance migrants to other countries head for major centers of economic activity.
Distance of Migration • Internal migration • Permanent mov’t w/in the same country (Occurs much more often than int’l migration) • Two types: • Interregional migration = movement from one region to another (Main type is from rural to urban areas in search of jobs). • Intraregional migration = movement within a region (Main type is from older cities to newer suburbs). • International migration • Permanent mov’t from one country to another • Two types: • Voluntary—Migrant has chosen to move for economic improvement • Forced—Migrant has been compelled to move by cultural factors • Migration transition • Change in migration pattern in a society that results from social and economic chagnes that also produce demographic change. • Int’l migration most common in countries in stage 2 of the demographic transition. Internal migration more common in countries in stage 3 or 4.
Internal Migration - Movement within a single country’s borders (implying a degree of permanence).
Ravenstein noted distinctive characteristics of migrants • Most long-distance migrants are male. • Held true for most of 19th and 20th centuries, when about 55% of US immigrants were male. • Pattern reversed in 21st century as women constituted 55%. • Most long-distance migrants are adult individuals rather than families w/ children. • Theory has held true for the most part—About 40% of immigrants are young adults between ages 25 & 39, compared to 23% of the entire US population. • However, an increasing number of immigrants are children (due to the fact that more women are immigrating and bringing their children w/ them).
Where Are Migrants Distributed? • Global migration patterns • Net out-migration: Asia, Africa, and Latin America • Net in-migration: North America, Europe, and Oceania • The United States, world’s third most populous country, has the largest foreign-born population (approximately 40 million in 2010).
Global Migration Patterns—Major flows of int’l migrants are from LDCs to MDCs, especially from Asia and Latin America to North America and from Asia to Europe. Figure 3-5
Net Migration by Country Figure 3-7
US Immigration Patterns—3 main eras • 1st Era—Initial settlement of colonies • Came from Europe and Africa—Most of the Africans were forced to migrate as slaves, whereas most Europeans voluntarily migrated. • First settlement in Jamestown (1607) until 1840—steady stream of Europeans migrated to American colonies (90% from Great Britain) • 2nd Era—19th Century Immigration from Europe • 1840s and 1850s—Immigration jumped from 20k to 200k. ¾ of these immigrants came from Ireland and Germany (N and W Europe) • 1880s—Scandinavians (especially Swedes and Norwegians) joined Western Europeans in migrating to US. • 1900-1914—Nearly a million ppl a year immigrated to US, 2/3 came from Southern and Eastern Europe, which was a result of the Industrial Revolution diffusing to these areas. • 3rd Era—Recent Immigration from LDCs • Immigrants steadily increased after WWII and then surged to historically high levels during 1990s and 21st century. More than ¾ of immigrants originated from Asia and Latin America.
Europeans comprised more than 90% of immigrants during 19th century. In 1950s, they still accounted for more than 50%. Latin America and Asia are now the dominant sources of immigration. Figure 3-8
Migration to the United States from Latin America—Mexico has been the largest source of immigrants to the US in recent decades. Figure 3-9
Impact of immigration on the United States • Legacy of European migration • Era of massive European migration ended w/ start of WWI b/c the war involved important source countries (Germany, Austria-Hungary) • Europe’s demographic transition • Stage 2 growth pushed Europeans out. Europe had a much higher NIR, so there was limited opportunities for economic advancement. • Most European countries are in stage 4 (low or negative NIR) and have economies capable of meeting the needs of their people. • Diffusion of European culture • Emigration of 65 million Europeans has changed the cultural traditions of the world (Indo-European languages are spoken by half the world). • Europeans frequently imposed political domination on existing population and injected their cultural values w/ little regard for cultural traditions (mostly in Asia and Africa).
Impact of immigration on the United States • Unauthorized immigration • 2008—An estimated 11.9 million undocumented immigrants • Around 59 % Mexico, 22% elsewhere in Latin America, 12% Asia. • 8.3 million of 11.9 million illegal immigrants were employed, which is 5.4% of the U.S. civilian labor force. • Crossing the border has not been difficult. It is 1,951 miles long and runs mostly through sparsely inhabited regions. • US has constructed a barrier covering ¼ of the border. Guards heavily patrol border crossings in urban areas such as El Paso, TX and San Diego, CA. • Rural areas are guarded by only a handful of agents.
Impact of immigration on the United States • Destinations of Immigrants w/in the US • California = one-fifth of all immigrants and one-fourth of undocumented immigrants • New York = one-sixth of all immigrants • Proximity influences some decisions but not all decisions • Chain migration—Describes the migration of people to a specific location b/c relatives or members of the same nationality previously migrated there. • Job Prospects—Affect the states to which immigrants head. South and West have attracted large percentage of immigrants b/c the regions have had more rapid growth in jobs than the NE or Midwest. However, in recent years, many immigrants have migrated to Midwest to take industrial jobs, such as meatpacking and related food processing.
Why Do Migrants Face Obstacles? • Immigration policies of host countries • Problem used to be environmental, now it’s cultural. • Immigration Policies of Host Countries • U.S. Quota Laws—The era of unrestricted immigration ended when Congress passed the Quota Act (1921) & theNational Origins Act (1924). These quotas placed maximum limits on the # of people who could immigrate to US in one year. • Laws stated: For each country that had native-born persons living in the US currently, 2% of their number could immigrate—intended to ensure that most immigrants would continue to be European. • System continued w/ minor modifications until the 1960s. • Our current law has a global quota of 620,000, w/ no more than 7% from one country. • Numerous qualifications and exceptions can alter this limit considerably
Granting Admission to Immigrants • Since the number of applicants far exceeds the quotas, Congress has set preferences: • ¾ of immigrants are admitted to reunify families, primarily spouses or unmarried children of people living in US. Typical wait for spouse to gain citizenship is 5 years. • The remaining ¼ of applicants are comprised of skilled workers and exceptionally talented professionals. • Other countries charge that by giving preference to skilled workers, immigration policies in US contribute to a brain drain, which is a large-scale emigration by talented people. • Scientists, doctors, and other professionals migrate to countries where they can make better use of their abilities.
Temporary Migration for Work • People unable to migrate permanently to a new country may be allowed to migrate temporarily for employment opportunities. Prominent forms include: • Guest workers in Europe and Middle East—These are citizens of poor countries who migrate for work. In Europe, they are useful b/c they take low-skill jobs that locals won’t accept. They make more money than they would have otherwise, and they ease the burden of UE in home country. • Time-contract workers in Asia—Recruited for a fixed period of time to work in mines or on plantations. When their contracts expired, many would settle permanently in their new country. • More than 33 million ethic Chinese currently live permanently in other countries, for the most part in Asia.
Turkish guest workers gathering at railway station in Munich, Germany. Most Turkish guest workers arrive in Germany by rail. The station and nearby businesses are a major gathering place for Turks.
Distinguishing economic migrants from refugees • Migrants are not admitted unless they possess special skills or have a close relative, but refugees receive special priority in admission to other countries. Distinguishing migrants from refugees has been difficult from these 3 countries: • Cuba—Under Fidel Castro in 1959, Cuba’s communist gov’t took over all private property. More than 600,000 were admitted, and most of them settled in southern Florida. Another wave came in 1980 when Castro decided to permit political prisoners, prisoners, and criminals to leave the country. Became known as the Mariel boatlift, named for the port which Cubans were allowed to embark. • Haiti—After 1980 Mariel boatlift, several thousand Haitians sailed to US. Claiming economic advancement as the reason, US immigration officials would not let the Haitians stay. • Vietnam—After capital of S. Vietnam was captured by N. Vietnam’s communist gov’t, the US evacuated several thousand people who had closely identified w/ American position and were vulnerable.
When Fidel Castro permitted some Cubans to leave the country, more than 125,000 sailed across the Straits of Florida, including this freighter, Red Diamond, with 850 refugees on board.
Refugees A person who flees across an international boundary because of a well-founded fear of being persecuted for reasons of race, religion, nationality, membership of a particular social group, or political opinion.
Cultural problems faced while living in host countries • U.S. attitudes towards immigrants • Always regarded new arrivals w/ suspicion. • Tempers intensified in 20th century when immigrants no longer came from Northern and Western Europe. Southern and Eastern Europeans (Italians, Poles, Russians) faced much more hostility than did British German and Irish immigrants did half century earlier. • Most recently, Americans have become hostile to illegal immigrants. For example, California has voted to deny unauthorized immigrants access to most public services such schools, day-care, and health clinics. These laws have been very hard to enforce. • Attitudes toward guest workers • In Europe, political parties that support restrictions on guest workers have gained popularity and attacks by local citizens have increased. • In Middle East to limit number of guest workers, petroleum-exporting countries have forced them to return home if they wish to marry and will prevent them from returning once they have wives and children.
US Census Bureau computes the country’s population center during each census. The changing location of the population center graphically demonstrates the march of American people across the North American continent over 200 years Can you guess where the center of population was for the following years: 1790? 1850? 1950? 2000? Record each of the years on a blank map.
Changing Center of the U.S. Population Figure 3-16
Migration Between Regions w/in U.S. • Colonial settlement • Population center near Maryland. Reflects that nearly all colonial-era settlements were near the Atlantic coast. • Early settlement in the interior (early 1800s) • Transportation improvements, especially building of canals, helped open the interior. Erie Canal enabled people to travel inexpensively by boat between NYC and Great Lakes.
Migration Between Regions w/in U.S. • California • Gold Rush in the 1840s—population shifted more rapidly west • Great Plains settlement • Advances in agricultural technology enabled people to cultivate the Great Plains. • Farmers used barbed wire to reduce dependence on wood fencing, steel plow to cut thick sod, and windmills to pump more water.
The introduction of barbwire led to the settling of the Great Plains.
Migrations Between Regions w/in US • Recent growth of the South • 1940-2000—With development of air conditioners, the South (aka “Sunbelt”) has increased population b/c of its more temperate climate. • Midwest referred to as “Rustbelt” b/c of its dependency on declining manufacturing (as well as the ability of the climate to rust out cars quickly). • Into the 21st century, interregional migration has slowed considerably. Regional differences in employment have become less dramatic.
Compared to 2007, 1995 figures show much higher total interregional migration and migration into the South