Download
1 / 25
250 likes | 268 Vues
Explore impact of spatial PHEV ownership distribution on local power grids using agent-based modeling; analyze charging strategies and grid pressure mitigation.

E N D
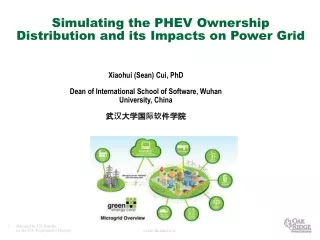
Simulating the PHEV Ownership Distribution and its Impacts on Power Grid Xiaohui (Sean) Cui, PhD Dean of International School of Software, Wuhan University, China 武汉大学国际软件学院
OUTLINE • Model spatial distribution of PHEV ownership at local residential level • Find PHEV hot zones (region with highly concentrate PHEV owners) • Analyze impact on the local electric grid with different incitement policies and PHEV user charging strategies
PHEV • Plug-in hybrid electric vehicles (PHEVs) offers promise to replace a significant portion of the US’s current fuel-based light vehicle fleet before electronic vehicle battery recharging infrastructure is fully deployed nationwide. • The general assumption is that the electric power grid is built to support peak loads and, as a consequence, suffers from low asset utilization rates in off-peak periods.
PHEV Impact on Power Grid • PHEV vehicle users will most likely charge their vehicles when convenient, rather than waiting for power grid off-peak periods. • Un-controlled charging strategy would place increased pressure on power grid but no additional generation capacity would be required if PHEVs charging cycles started in the off-peak periods. (Lilienthal and Brown 2007) • Most US regions would need to build additional generation capacity to meet the added electric demand when PHEVs are charged in the evening. (Hadley and Tsvetkova, 2009) • Variability in charging times for vehicles may have a critical impact on the local electric grid infrastructure (Letendre and Watts, 2009)
Challenges • Most efforts ignore the possibility of spatially variable PHEV penetration in different residential areas • PHEV penetration rate is expected to vary with household demographic and socioeconomic attributes such as income, travel distance, age, household size, education. • Specific points along some electric distribution lines may face overload if local patterns of electricity demand change significantly because of PHEV recharging
ChargingwithRenewableEnergy 全球10米高度风力 通过使用美国USGS以及欧洲ESA提供的地表覆盖300M图以及由NOAA提供的全球气象观察点数据成功建立全球风能与太阳能分布信息
Agent-based Framework for Modeling Spatial Distribution of PHEVs • Develop an agent-based framework for modeling spatial distribution of PHEV household adoption in residential areas • Evaluate the impacts of vehicles charging load on a residential electric distribution network with different charging strategies • Discover the ‘‘PHEV hot zones’’ where PHEV ownership may quickly increase in the near future • Use Knox County, Tennessee as a case study to show the simulation results of this agent-based model (ABM) framework
The Design of Desired Collective Behaviors with Agent Based Simulation Simple but predictable local interactions among many intelligent agents can generate familiar but enigmatic social patterns, such as stock market crashes, revolutions, fads and feeding frenzies. By carefully tuning the interaction between agents, it is possible generate desired collective behaviors Desired Behaviors Emergent Behaviors Collective Interaction Local Interaction Decision Behavior Action Perception
High Fidelity Household Demographic Data • The high fidelity input data for agent-based simulation is the primary assurance for the simulation to generate meaningful results • High fidelity household characteristics, individual locations and behaviors are used in the ABM simulation for estimating each individual household (agent) vehicle choice behavior. • There are 190,965 households in the Knox County, which means 190,965 agents are created in this ABM simulation platform.
LandScan (synthetic household data) • ORNL's LandScan is the community standard for global and USA population distribution. The finest resolution global population distribution data available. • LandScanUSA: 3” (90 meters x 90 meters) resolution. • LandScanGlobal: approximately 1 km2 resolution (30" X 30”)
Synthetic Population Synthesizing population and personal demographic data from surveyed samples with behaviorally realistic and theoretically sound approaches
Typical Person Travel Behaviors Public Trans Public Trans Office Office Cafeteria Shopping Mall Home Car Car Home Coffee shop Working site Car Bar Car Bus School Bus 8 AM time 10 PM
2. DATA Validation • Without correct data, no system can function well. It is garbage in and then garbage out. • ABM need validated high fidelity and accurate data • Population distribution data validation • Transportation • Social Networks validation • Travel behaviors validation
Consumer Decision Model in ABM • A PHEV vehicle ownership distribution model at high resolution (Household) level • Individual households with different characteristics are represented by agents • Decision Models • Consumer choice model (Lin and Greene, 2010) for PHEVs choice • University of Michigan Transportation Research Institute (UMTRI) model (Sullivan et al., 2009) for estimating the time when consumers start searching for a new car • Stigmergy-based neighborhood effect model (Cui et al., 2009) for estimating the probability of consumer’s selection for different PHEV. • Vehicles consumer can choose from • PHEV-10 • PHEV-20 • PHEV-40 • others, which include hybrid electric vehicles and traditional Internal Combustion Engine (ICE) vehicles)
ABM Simulation • Estimate PHEV ownership distribution in year 2025 • Use the two scenarios, Base Case and FreedomCARGoals Case defined in Lin and Greene (2010) • Apply US Energy Information Administration’s Annual Energy Outlook 2010 report for 2012 – 2025 energy estimating prices • Aggregate the individual household PHEV number based on the census block group (234 BGs in the Knox County) in which individual households are located • Discover the ‘‘PHEV hot zone’’ – the highest PHEV ownership concentration community
Distribution of PHEV Ownership The distribution of the PHEV in Knox County for 2025 based on the base scenario
Distribution of PHEV Ownership The distribution of the PHEV in Knox County for 2025 based on The newenergy carincitement scenario
Comparing of Two Scenarios • The “newenergy carincitement scenario”suchasFreedomCARGoals scenario will have a higher PHEV market penetration than Base Case. • Both scenarios indicate that the southwest portion of the county (which is the Town of Farragut) will have the highest PHEV concentration.
Simulation Results • Four census block groups (46, 57, 58 and 62) from the 234 BGs in Knox County, have the highest estimated PHEV penetration under the FreedomCARGoals Scenario. • The evening peak charging load for these BGs can reach 3625 kW, 32.6% of the vehicle charging load generated by the fleet in the Knox County. These BGs can be considered as the ‘‘PHEV hot zones’’. • Residential neighborhoods, where multiple PHEV consumers share a given circuit to recharge their plug-in vehicles, could increase peak demand locally and require utilities to upgrade the distribution infrastructure.
Conclusion • In a region the overall electric generation and grid capacity may be underutilized • However, PHEV hot zone could increase peak electric demand locally and cause system disruptions and eventually require upgrading of the electric distribution infrastructure.
Issues with ABM • Validity • Every model serves its own unique purpose • Must be built at the right level of description with the appropriate amount of complexity • Human agents • Complex Psychology • Irrational Behavior • Subjective Choices
All Models Are Wrong • but Some are Useful • Practical Question: How wrong do model has to be to not be useful? • New Model Validating Protocol – “Trustability Level of the ABM” • Exploring the model validating protocol that can providing the numerical trustability level of the ABM for a spectrum of scenarios • Provide a numerical value about the predictability quality of an ABM
Practical Validation* • Perform a series of experiments to invalidate the model • Models shown to be invalid are salvageable with further work • Models may have parameter settings resulting in valid and invalid end states • End result of validation exercises • A model that has passed some validation tests (not a totally validated model) • A better understanding of the model’s capabilities, limitations, and usefulness * Excerpt from Macal, C.M., Model Verification and Validation (presentation); Workshop on Threat Anticipation: Social Science Methods and Models, University of Chicago and Argonne National Laboratory, April 2005.
Issues with ABM • Qualitative vs. Quantitative • Varying degree of accuracy and completeness in input (data, expertise, etc) • Use qualitative data to learn about the system • Capturing the behavior of all constituent units • Lower level description can extremely computationally intense, and time consuming • Heterogeneous units
Contact Information: Xiaohui (Sean) Cui, PhD Computational Data Analytics Group, Oak Ridge National Lab, USA International School of Software, Wuhan University, China Email: xcui@whu.edu.cn USA Phone: (865)896-9799 China Phone: 133-0714-6750