Download
1 / 23
230 likes | 394 Vues
Laboratoire de Modélisation de la Chimie Atmosphérique http://lmca.epfl.ch. Modification of the chemical environment during long-range transport. M. Auvray & I. Bey. Acknowledgements: C. Reeves (chemical terms), S. Turquety (biomass burning emissions), ACSOE – EXPORT – ICARTT/ITOP teams, ….

E N D
Laboratoire de Modélisation de la Chimie Atmosphérique http://lmca.epfl.ch Modification of the chemical environment during long-range transport M. Auvray & I. Bey Acknowledgements: C. Reeves (chemical terms), S. Turquety (biomass burning emissions), ACSOE – EXPORT – ICARTT/ITOP teams, … Swiss Federal Institute of Technology, Lausanne, Switzerland GEOS-CHEM Meeting – April 2005
Scientific questions Perturbation of O3 chemical terms by long range transport 1. How is the model capable to reproduce observed O3production and loss rates (focus on the North Atlantic/Europe area) ? 2. To what extent long-range transport modify these chemical terms?
Aircraft campaigns Methodology The Model GEOS-CHEM version v7-01-02 Resolution 2° x 2.5° EMEP emissions over Europe One-year initialisation Definitions Ozone produced from natural emissions of NOx and VOCs + CH4+ stratospheric ozone Hemispherical Background Ozone produced from anthropogenic emissions emitted over North America North American contribution Ozone produced from anthropogenic emissions emitted over Europe European contribution Ozone produced from anthropogenic emissions emitted over Asia Asian contribution
European contribution Asian contribution N. American contribution Hemispheric background O3(ppbv) CO (ppbv) NO (pptv) PAN (pptv) NOy (pptv) April Observations September Model Europe N. Am. Comparison with key observed chemical species - ACSOE O3 budget over the ACSOE domain, April 1997
Evaluation of O3 production and loss term with ACSOE, April 1997 - 1 Reeves et al. GEOS-CHEM Data from Reeves et al., JGR, 2002 Grid-box model constrained by measured in situ photolysis rate and observed concentrations of O3, H2O, CO, H2O2 and CH3OOH
Evaluation of O3 production and loss term with ACSOE, April 1997 - 2 Evaluation of individual reactions GEOS-CHEM Reeves et al. O3 + hν 2 OH O3 + HO2 2 O2 + OH NO + HO2 NO2 + OH NO + CH3O2 NO2 + CH3O O3 + OH O2 + HO2 Data from Reeves et al., JGR, 2002
Sensitivity of O3 chemical terms to ship emissions during ACSOE, April 1997 Standard simulation Simulation without ship emissions Data from Reeves et al., JGR, 2002
Comparison with key observed chemical species - EXPORT, July & August 2000 European contribution Asian contribution N. American contribution O3 budget over the EXPORT domain Hemispheric background O3(ppbv) CO (ppbv) NO (pptv) NO2(pptv) PAN (pptv) NOy (pptv) Observations Model – EMEP Model – no EMEP Europe N. Am.
Evaluation of O3 production and loss term with EXPORT, July & August 2000 Zoom GEOS-CHEM Reeves et al. Data from Reeves et al., EXPORT-E2 Final Report, 2002
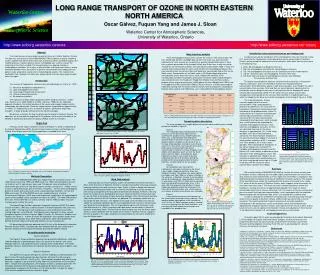
NAm Plume Background Difference 2. Perturbation of the background environment over the North Atlantic ocean by North American plume North American plume: boxes where CONAm > (median + st dev) CONAm Background: boxes where CO < median CO O3 Prod Loss [ppbv/day] O3 net Prod [ppbv/day]
NAm Plume Background Difference 3. Seasonal variations of production and loss of O3 over the North Atlantic ocean January April July October O3 Prod Loss [ppbv/day] O3 net Prod [ppbv/day]
Preliminary conclusion ACSOE: O3 production is overestimated, specially < 4 km O3 loss is underestimated, specially < 3 km EXPORT: O3 net production is overestimated in upper troposphere Next step: Examine sensitivity of O3 production and loss rates 1. To different parameters: - relative humidity - J-value - heterogeneous reactions on aerosols 2. Using outputs from another 3D global model (MOZECH – collaboration with M. Schultz, MPI-Hamburg) 3. Use the ICARTT/ITOP data
Comparison ITOP/ICARTT obs. - GEOS-CHEM Observations Model – S. Turquety Biomass burning emissions O3(ppbv) CO (ppbv) NO (pptv) NO2(pptv) PAN (pptv) NOy (pptv) DC8 P3 BAE 146 Falcon
Continuation of the ICARTT/ITOP project Focus on long-range transport of aerosol: how does it impact Europe? Case-study: aerosol layer, seen by the DLR and by the lidar at Paris DLR Falcon 23 July 04 (Courtesy: Hans Schlager)
Emissions in GEOS-CHEM – NOx in July Basic inventory EMEP inventory 1998-2000
Emissions in GEOS-CHEM – CO in July Basic inventory EMEP inventory 1998-2000
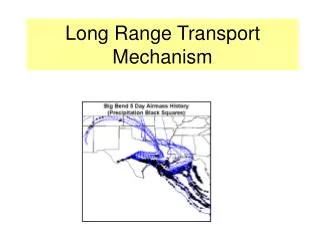
O2 hν O3 O O O3 hν O2 Production of O3 k1 k2 NO + HO2 NO2 + OH NO + CH3O2 NO2 + CH3O RCHO O2 NO HO2 RO NO2 O2 H2O NO2 OH RO2 NO HNO3 RH PO3 = k1 [NO] [HO2] + k2 [NO] [CH3O2]
Destruction of O3 LO3 = k3 [O3] [OH] + k4 [O3] [HO2] + J [O3] HO2 O3 hν O2 O1D O2 H2O O3 OH k3 k4 J O3 + OH O2 + HO2 O3 + HO2 2 O2 + OH O3 + hν 2 OH
O2 hν O3 O O O3 hν O2 Production and destruction of O3 NO + HO2 NO2 + OH NO + CH3O2 NO2 + CH3O RCHO O2 NO HO2 RO NO2 O3 hν O2 O1D O2 H2O O3 O2 H2O NO2 OH RO2 NO HNO3 RH O3 + OH O2 + HO2 O3 + HO2 2 O2 + OH O3 + hν 2 OH
Production and destruction of O3 NO + HO2 NO2+ OH NO + CH3O2 NO2 + CH3O RCHO O2 NO HO2 RO NO2 O3 hν O2 hν O3 O O O3 O2 O1D hν O2 H2O O2 O3 O2 H2O NO2 OH RO2 NO + NO2 NOy PAN HNO3 RH CO O3 + OH O2 + HO2 O3 + HO2 2 O2 + OH O3 + hν 2 OH
Evaluation of O3: a case study – ACSOE, 14th of September 1997 Auvray and Bey, 2005
Location of the ICARTT/ITOP campaigns P3 DC8 Falcon BAE 146