Problem Solving
Problem Solving. Section 1.2 (8). Section Objectives (8). Learn a method (five-step or the Given, Find, How, Solve, Check, Solution) for a logical problem-solving procedure. Solve problems involving bar, line, and circle graphs. Solve simple problems using statistics.

Problem Solving
E N D
Presentation Transcript
Problem Solving Section 1.2 (8)
Section Objectives(8) Learn a method (five-step or the Given, Find, How, Solve, Check, Solution) for a logical problem-solving procedure. Solve problems involving bar, line, and circle graphs. Solve simple problems using statistics.
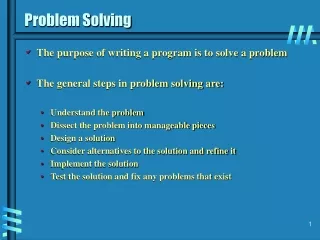
1.2.1 5-Step Method - 1(8) • Understand the problem a. Read problem carefully at least twice b. Make a list of given facts c. Determine is you can use smaller values d. Organize info in a table, if it helps e. If possible sketch a pic, if it helps • Translate the problem into math terms a. Express the terms in an equation (Ch 3) b. Determine if your formula makes sense
1.2.1 5-Step Method - 2(9) • Carry out the math necessary to solve • Check the answer a. Check and see if the answer is reasonable b. Actually check solution in original eqn • Make sure you answered the problem State answer clearly and don’t forget the units.
Alternate Method - 1 Of course, read the problem just to get the gist of it. Then reread it to insure your original interpretation is correct. If a picture helps (e.g. a triangle if it fits the input) GIVEN: Write down each given fact down, each on a separate line. FIND: Write down what you need to find HOW: Determine what would be the best equation to use to solve problem. SOLVE: Do the math to solve for “x”
Alternate Method - 2 CHECK: Insure solution is reasonable, then plug it in original equation. SOLUTION: Write the solution down and don’t forget the units. Don’t forget that both methods assume you picked the right equation to begin with. Checking something wrong to begin with, don’t work.
Example 1 You want to put a fence around part of your lot on the river. You have 120 feet of fencing. You want the side parallel to the river be twice as long. Assume you don’t fence the river. What are the length and width of the fence? width width total fence = 120 ft length
Example 1 (cont) GIVEN: total fencing is 120 ft 2 widths 1 length length is twice the width FIND: dimensions of fence HOW: Let the length = twice width, and sum of 2 width + 1 length = total SOLVE: Let x = width 2x = length
Example 1 (cont 2) SOLVE: 2 ( x ) + 2 x = 120 4x = 120 x = 30 (width) 2x = 60 (length) CHECK: Solution sounds fairly reasonable 2 ( 30 ) + 60 ? 120 120 = 120 SOLUTION: The width is 30 feet, and the length is 60 feet.
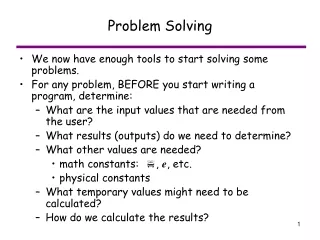
Example 2 You and your three friends go to Burger King and each of you want two double cheeseburgers and large drink. The burgers are on special for 99¢ each. The pops are $1.29 each. Nebraska has a 7% sales tax. What is the total bill? GIVEN: 4 people Everyone has two burgers Each have a pop Nebraska get 7% of the total.
Example 2 (cont) Find: The total tab How: four times each person’s order plus the tax equals the bill Solve: 4 [ 2 ( .99 ) + 1.29 ] { 1.07 } = x 4 [ 1.98 + 1.29 ] { 1.07 } = x 4 [ 3.27 ] { 1.07 } = x 13.08 { 1.07 } = x 13.9956 = x x = 14.00 (rounded to nearest cent)
Example 2 (cont 2) CHECK: Sounds reasonable $3.27 • 4 + tax SOLUTION: The total check is $14.00
1.2.2 Solve Problems with Graphs(12) Essentially, we are learning to read graphs. The vertical value is normally the dependant value ( y ) and the horizontal value is normally the independent value ( x ). We read right/left for the value of x, and up/down for the value of y. The problem with solving by graphing is that the value often have to be estimated.
Bar Graphs Example: # 700 530 600 470 465 S 500 411 A400 L 300 E200 S100 2005 2006 2007 2008 year With few horizontal line, guestimate
Example 3 Using the values on previous page, what was the average sales per year for the four given years? GIVEN: The values were 411, 470, 530, 465 There were 4 years of data FIND: The average sales for 2005 to 2008 HOW: Divide sum of sales by # of years SOLVE:
Example 3 (cont) CHECK: Values seem to be reasonable SOLUTION: The average sales per year was 469 sales.
Circle Graphs Graduate Students divorced Single 23% 43% married 34%
Example 4 There are 1200 graduate students at State U. How many are not currently divorced? single – 43%, divorced – 23%, married – 34% GIVEN: 1200 grad students 23% divorced FIND: Number students not divorced HOW: Subtract divorced from total SOLVE: x = 1200 – 0.23 • 1200 x = 1200 – 276 x = 924
Example 4 (cont) CHECK: 924 looks like about ¾ total SOLUTION: There are 924 graduate students who are not divorced
Linear Graphs 800 - - - - - - - - - - - - - - - - 700 - - - - - - - - - - - - - - - - 600 - - - - - - - - - - - - - - - - 500 - - - - - - - - - - - - - - - - 400 - - - - - - - - - - - - - - - - 300 - - - - - - - - - - - - - - - - 200 - - - - - - - - - - - - - - - - 100 - - - - - - - - - - - - - - - - - - | - - | - - | - - | - - | - - | - - | - - | - - | - - | - 1 2 3 4 5 6 7 8 9 10
Example 5 Using the graph on the previous page, guestimate the change between year 5 and year 7. GIVEN: at 5, the value was 560 at 7, the value was 240 FIND: change from year 5 to year 7 HOW: value at year 5 – value year 7 SOLVE: x = 240 - 560 x = -320 CHECK: It did go down a fair bit, check SOLUTION: The change between year 5 and year 7 was -320.
1.2.3 Solve Problems Using Statistics(14) Thank goodness we are scratching the surface of statistics. The two terms we will use in this class (measures of central tendency) are the mean (average) and the median (middle). The mean of 52, 55, 51, 62, 45 is To dermine the median, we have to order 1st 45, 51, 53, 55, 62, the median = 53 The median of 6, 8, 11, 13 = (8 + 11)/2 = 9.5
Section Objectives(8) Learn a method (five-step or the Given, Find, How, Solve, Check, Solution) for a logical problem-solving procedure. Solve problems involving bar, line, and circle graphs. Solve simple problems using statistics.
Problem Solving Section 1.2 (8)