Analyzing Credit Card Balances for Capital Credit Union Using Histograms in Excel
160 likes | 278 Vues
This guide provides a step-by-step process for analyzing credit card balances of Capital Credit Union customers using frequency distribution and histograms in Excel 2007. By utilizing a dataset of 300 observations, users will learn how to create a histogram with ten class intervals using Excel functions to determine the maximum and minimum balances. The tutorial covers calculating class widths, constructing bins, and formatting the histogram for clear data visualization, ensuring accurate insights into customer credit card spending.

Analyzing Credit Card Balances for Capital Credit Union Using Histograms in Excel
E N D
Presentation Transcript
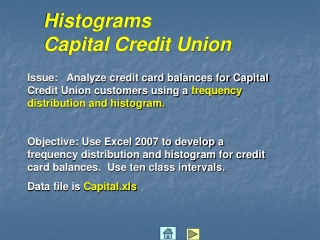
HistogramsCapital Credit Union Issue: Analyze credit card balances for Capital Credit Union customers using a frequency distribution and histogram. Objective: Use Excel 2007 to develop a frequency distribution and histogram for credit card balances. Use ten class intervals. Data file is Capital.xls
Histograms-Capital Credit Union • Open the Excel file “Capital.xls” • The file contains 300 observations – The last row is 302 – Column 2 (B) contains the balances
Histograms-Capital Credit Union c Use Excel’s “Max” function to determine the largest valueMax(b2:b301) Note: ignore the cell number in the RED circle
Histograms-Capital Credit Union c Use Excel’s Min function to determine the smallest value Min(b2:b301) Note: ignore the cell number in the RED circle
Histograms-Capital Credit Union • Compute Class Width • Compute range as Maximum – Minimum: 1493 – 99 = 1394 • Excel: 2^k >= n (300) • 2^8=256 and 2^9=512 • Take 10 instead of 9 because of convenience • Divide range by 10 to construct 10 classes: 1394 / 10 = 139.40 • Round up to $150.00 (width) • Intervals are: • $90 to < $240 (90+150) • $240 to < $390 • $390 to < $540 • Etc…
Histograms-Capital Credit Union Intervals are: $90 to < $239.99 $240 to < $389.99 $390 to < $539.99 $540 to < $689.99 $690 to < $839.99 Go on ….. ….. …. ….. …< $1589.99
Histograms-Capital Credit Union • Construct the Bins (The upper limits of each class • Intervals are: • $90 to < $239.99
Histograms-Capital Credit Union • Select the Data tab • Select Data Analysis • Select Histogram • OK
Histograms-Capital Credit Union Input Range is Column B. Bin Range is Column F – The range of Bins that you entered. Select New Worksheet Ply Select Chart Output OK
Histograms-Capital Credit Union Frequency legend This is Excel’s default output. It should be modified for most applications. The first change would be to delete the Frequency legend , change the Bins title to Balances and increase the size of the chart using the resize handles. Bins Title Sizing Handle
Excel’s default on a histogram is to include a More category. Remove the More category from the chart. Select the chart, right mouse click, Select Data, Edit Frequency. In the Edit Series dialog box, change Series Values to $B$11 rather than $B$12. Click OK.
Histograms-Capital Credit Union • Right click on any of the bars in the Histogram • Select Format Data Series
Histograms-Capital Credit Union Set Series Overlap and Gap Width to Zero to format the Histogram as shown
Histograms-Capital Credit Union To put border colors around the bars of the histogram , select Border Color, Choose Solid line, Select the Color arrow, and Choose Dark Blue, Text 2 Theme Color.
Histograms-Capital Credit Union Change the Bins categories to 0-239.99, 240-389.99, etc. and delete the More bins and frequency. Change the Histogram title to Credit Card Balances. See next slide for results of these changes.