A Fuzzy Logic Based Analog Forecasting System for Ceiling and Visibility
A Fuzzy Logic Based Analog Forecasting System for Ceiling and Visibility. Bjarne Hansen, Meteorologist Cloud Physics and Severe Weather Research Division Meteorological Research Branch Meteorological Service of Canada Dorval, Québec

A Fuzzy Logic Based Analog Forecasting System for Ceiling and Visibility
E N D
Presentation Transcript
A Fuzzy Logic Based Analog Forecasting System for Ceiling and Visibility Bjarne Hansen, Meteorologist Cloud Physics and Severe Weather Research Division Meteorological Research Branch Meteorological Service of Canada Dorval, Québec 39th Congress of the Canadian Meteorological and Oceanographic Society, 31 May - 3 June 2004, Vancouver, British Columbia
Outline Introduction • Ceiling and visibility prediction • Fuzzy logic • Analog forecasting / k-nearest neighbors Combining all of the above Operational application: WIND-3
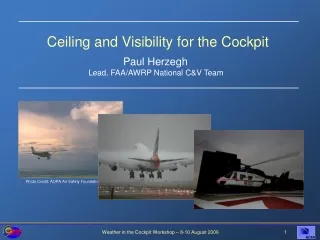
Ceiling and Visibility Prediction Critical airport forecasts for: planning, economy, and safety.Ceiling height and visibility prediction demands precisionin near-term and on local scale: • Ceiling height, when low, accurate to within 100 feet. • Visibility, when low, accurate to within 1/4 mile. • Time of change of flying category should be accurate to within one hour. Safety concern “Adverse ceiling and visibility conditions can produce major negative impacts on aviation - as a contributing factor inover 35% of all weather-related accidents in the U.S. civil aviation sector and as a major cause of flight delays nationwide.” 1 1. RAP/NCAR, Ceiling and visibility, Background, http://www.rap.ucar.edu/asr2002/j-c_v/j-ceiling-visibiltiy.htm
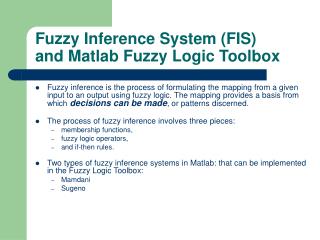
Fuzzy set to describethe degree to whichtwo numbers aresimilar, for example,degree of similarityof temperatures. Similar Not similar Non-fuzzy (classical) setloses information aboutdegree of similarity. Fuzzy Logic Definition “Fuzzy logic a superset of Boolean logic dealing with the concept ofpartial truth – truth values between ‘completely true’ and ‘completely false’.It was introduced by Dr. Lotfi Zadeh of UCB in the 1960’s asa means to model the uncertainty of natural language.” 1 1. Free On-line Dictionary of Computing, http://foldoc.doc.ic.ac.uk/foldoc
Analog Forecasting /k-nearest neighbors • A basic statistical learning technique • Analog forecasting and regression arecomplementary • Linear regression of 0/1 response → 1. Trevor Hastie, Robert Tibshirani, Jerome Friedman, 2001: The Elements of Statistical Learning: Data Mining, Inference, and Prediction, Springer Series in Statistics, Springer-Verlag, New York, NY, USA, pp. 11-18.
Analog Forecasting /k-nearest neighbors • 1 nearest neighbor classifier 1→ 1. Trevor Hastie, Robert Tibshirani, Jerome Friedman, 2001: The Elements of Statistical Learning: Data Mining, Inference, and Prediction, Springer Series in Statistics, Springer-Verlag, New York, NY, USA, pp. 11-18.
Analog Forecasting /k-nearest neighbors • 15 nearest neighbor classifier 1→ 1. Trevor Hastie, Robert Tibshirani, Jerome Friedman, 2001: The Elements of Statistical Learning: Data Mining, Inference, and Prediction, Springer Series in Statistics, Springer-Verlag, New York, NY, USA, pp. 11-18.
Analog forecasting / k-nn complements Linear Regression Compared to the linear model approach(basis of most statistical systems for C&V prediction) : 1. The k-nearest neighbors techniqe has arelative lack of structural assumptions about data. “The linear model makes huge assumptions about structure and yields stable but possibly inaccurate predictions. The method of k-nearest neighbors makes very mild structural assumptions:its predictions are often accurate but can be unstable.”1 2. k-nn is computationally expensive, but newly practical. Both points borne out in ceiling and visibility prediction system… 1. Trevor Hastie, Robert Tibshirani, Jerome Friedman, 2001: The Elements of Statistical Learning: Data Mining, Inference, and Prediction, Springer Series in Statistics, Springer-Verlag, New York, NY, USA, pp. 11-18.
Operational Application: Prediction System: WIND-3 WIND: “Weather Is Not Discrete” Consists of three parts: • Data – weather observations and model-based guidance; • Fuzzy similarity-measuring algorithm – small C program; • Prediction composition – predictions based on selected C&V percentiles in the set of k nearest neighbors, k-nn. Data: what current cases and analogs are composed of • Past airport weather observations: 190 airports, 30 years of hourly obs, time series of ~ 300,000 detailed observations; • Recent and current observations (METARs); • Model based guidance (knowledge of near-term changes, e.g., imminent wind-shift, onset/cessation of precipitation).
Data: Past and current observations, regular METARs Type temporal cloud ceilingand visibility wind precipitation spread andtemperature pressure Attribute date hour cloud amount(s)cloud ceiling heightvisibility wind directionwind speed precipitation typeprecipitation intensity dew point temperaturedry bulb temperature pressure trend Units Julian date of year (wraps around) hours offset from sunrise/sunset tenths of cloud cover (for each layer)height in metres of ³ 6/10ths cloud coverhorizontal visibility in metres degrees from true northknots nil, rain, snow, etc.nil, light, moderate, heavy degrees Celsiusdegrees Celsius kiloPascal × hour -1
Data: Past and current observations E.g., over 300,000 consecutive hourly obs for Halifax Airport, quality-controlled. YY/MM/DD/HH Ceiling Vis Wind Wind Dry Dew MSL Station Cloud Directn Speed Bulb Point Press Press Amount 30's m km 10's deg km/hr deg C deg C kPa kPa tenths Weather 64/ 1/ 2/ 0 15 24.1 14 16 -4.4 -5.6 101.07 99.31 10 64/ 1/ 2/ 1 13 6.1 14 26 -2.2 -2.8 100.72 98.96 10 ZR- 64/ 1/ 2/ 2 2 8.0 11 26 -1.1 -2.2 100.39 98.66 10 ZR-F 64/ 1/ 2/ 3 2 6.4 11 24 0.0 -0.6 100.09 98.36 10 ZR-F 64/ 1/ 2/ 4 2 4.8 11 32 1.1 0.6 99.63 97.90 10 R-F 64/ 1/ 2/ 5 2 3.2 14 48 2.8 2.2 99.20 97.50 10 R-F 64/ 1/ 2/ 6 3 1.2 16 40 3.9 3.9 98.92 97.22 10 R-F 64/ 1/ 2/ 7 2 2.0 20 40 4.4 4.4 98.78 97.08 10 F 64/ 1/ 2/ 8 2 4.8 20 35 3.9 3.3 98.70 97.01 10 F 64/ 1/ 2/ 9 4 4.0 20 29 3.3 2.8 98.65 96.96 10 R-F 64/ 1/ 2/10 6 8.0 20 35 2.8 2.2 98.60 96.91 10 F 64/ 1/ 2/11 8 8.0 20 32 2.8 2.2 98.45 96.77 10 F 64/ 1/ 2/12 9 9.7 23 29 2.2 1.7 98.43 96.75 10 F 64/ 1/ 2/13 9 11.3 23 32 1.7 1.1 98.37 96.69 10 ...
Predicted weather sequence would suggest lifting C&V. Data: Computer model based guidance 1 Predictions of weather elements related to C&V,e.g. temperature, dewpoint, wind, weather, dp/dt. 1. Any available model output can be used.
Archive search is like contracting hypersphere centered on present case. Axes measure differences weather elements between compared cases. Distances determined by fuzzy similarity-measuring functions,expertly tuned (for first approximation), all applied together simultaneously. Basic idea,key to k-nn presentweather Forecast ceiling and visibilitybased on outcomes ofmost similar analogs. Analogensemble need anintelligentsimilaritymeasure ~ 106points . . . C&V evolution . Spread in analogs helps toinform about appropriateforecast confidence. weather states ordered points in 12-D weather sequences generally continuous loci weather variables tend to flow in certain directions Algorithm: Collect Most Similar Analogs, Make Prediction For algorithm details, see reference papers orsend an e-mail. To see basic idea, visualize…
MSC aviation weather service reorganization Two Canadian Meteorological Aviation CentresCMAC-West in Edmonton, CMAC-East in MontrealProducts: TAFs, GFAs, SIGMETs, AIRMETs CMAC-W97 TAFs 39 forecasters 6-7 operational desks CMAC-E 83 TAFs 33 forecasters 5-6 operational desks CMAC-W For more information,contact Steve Ricketts,Manager CMAC-W,steve.ricketts@ec.gc.ca CMAC-E New opportunities Develop software to assist forecasters to handle data, increase situational awareness, and write TAFs Increase follow-up on verification statistics Develop new products
Prediction Probabilistic forecast: 10 %ile to 50%ile cig. and vis. from analogs
CSI = hits / (hits + misses + false alarms), IFR flying category Þ Ceiling < 1000 feet or Visibility < 3 miles. • Statistics are comprehensive for 190 Canadian airports for period from February - April 2005. • TAF statistics are from the Aviation TAF Performance Measurement Web Site, http://performance.ec.gc.ca • CVG-3 statistics from WIND forecasting system for ~350,000 24-hour forecasts made hourly. • WIND system forecasts ceiling and visibility using analog forecasting (data-mining and fuzzy logic). • Data consists of current METARs, climatology (hourly obs from 1971-2004), and GEM-based MOS guidance (mainly for the 6-24 hour projection period) from CMC. • For more details, visit: http://collaboration.cmc.ec.gc.ca/science/arma/bjarne/wind3
Key Points Two technologies help to improve forecasting systems: • Fuzzy logic is useful for making expert systems; • Analog forecasting is effective for ceiling and visibility forecasting. Forecasters using tools with this technology can: • Increase the quality of forecast products; • Increase the efficiency of forecast production.
… → “Conclusion” By building expert systems that combine artificial intelligence (AI), large amounts of data (climatological and current, remotely sensed and ground based), currently available computing power,model based guidance, and forecaster expertise, we can: Increase value of model output; Increase value model-based and post-processing based weather forecast products; Increase forecast quality, variety, and forecasting efficiency.
R&D of techniquesto improve C&V detection and forecasting couldhelp to improvepublic and marine forecasting. Lowered visibility due to fog,affects automotive safety. 2 Safety concern C&V affect aviation safety. “Adverse ceiling and visibility conditions can produce major negative impacts on aviation - as a contributing factor in over 35% of all weather-related accidents in the U.S. civil aviation sector and as a major cause of flight delays nationwide.” 1 2. Transport Canada: Trends in Motor Vehicle Collision Statistics, 1988-1997, prepared by Road Safety and Motor Vehicle Regulation Directorate. February 2001. (courtesy of Bruce Whiffen, 2003: personal communication) 1. RAP/NCAR, Ceiling and visibility, Background, http://www.rap.ucar.edu/asr2002/j-c_v/j-ceiling-visibiltiy.htm Ceiling and Visibility Prediction Aviation weather forecasting that is very concerned with nowcasting. Ceiling height and visibility prediction demands precision in near-term and on local scale: • Ceiling height, when low, accurate to within 100 feet. • Visibility, when low, accurate to within 1/4 mile. • Time of change of flying category should be accurate to within one hour.
Fuzzy Logic Use of fuzzy logic hasincreased exponentiallyover the past 30 years,based on the number of uses of the word “fuzzy” in titles of articles in engineering and mathematical journals. 1 In meteorological systems,use of fuzzy logic beganabout ten years ago. 2 1. Lofti Zadeh, 2001: Statistics on the impact of fuzzy logic, http://www.cs.berkeley.edu/~zadeh/stimfl.html 2. Meteorological applications of fuzzy, http://chebucto.ca/Science/AIMET/applications
Prediction System – Data Structure and Case Retrieval Compose present case: recent obs + NWP Collect most similar past cases Present Case Recentpast Timezero Future a(t0-p) a(t0) guidance ... ... TraversingCase Base Similarity measurement b(t0-p) b(t0) b(t0+p) ... ... ... ... ... ... Past Cases
Related MSC aviation weather related research • Nowcastingwith the Airport Vicinity Icing and Snow Advisor (AVISA), related to Alliance Icing Research Study (AIRS), www.airs-icing.org. For information about AIRS contact George Isaac, Senior Scientist, Meteorological Research Branch, george.isaac@ec.gc.ca. • WIND System - Automated analog forecasting, could be combined with AVISA to make a future airport weather prediction system. • Comprehensive Fog Modeling Team - a new initiative to coordinate several lines of fog-related research (e.g., AVISA, WIND, Lunenburg Project, NWP modeling, and detection from satellite) in a long-term research program aimed at satisfying user needs. Users include aviation, Search and Rescue, military, shipping, industry and the public. For information, contact Stewart Cober, Chief of Cloud Physics and Severe Weather Research Division, stewart.cober@ec.gc.ca.
Fuzzy Logic Applications Fuzzy logic is used in expert systems in hundreds of domains: transportation, automobiles, consumer electronics, robotics, pattern recognition, classification, telecommunications, agriculture, medicine, management, education. 1 Fuzzy logic models uncertainty inherent in descriptions of continuous,real-world systems. There are many fuzzy logic based systems that deal with environmental data: agriculture, climatology, ecology, fisheries, geography, geology, hydrology, meteorology, mining, natural resources, oceanography, petroleum industry, risk analysis, and seismology. 2 1. Munakata, T. and Jani, Y., 1994: Fuzzy Systems: An Overview, Communications of the ACM, Vol. 37, No. 3, pp. 69-76.2. Hansen et al. 1999, http://chebucto.ca/Science/AIMET/fuzzy_environment
Fuzzy Logic at Research Applications Program, NCAR According to Richard Wagoner, Deputy Director at Research Applications Program (“Technology Transfer Program”), NCAR: 1 • NCAR / RAP is now a “continuous set theory” [fuzzy set theory] development center. • Over 90% of systems developed use fuzzy logic [FL] as the intelligence integrator.[ … P.S. It is now 100% 2 ] • [FL offers] unprecedented fidelity and accuracy in systems development. • Automatic FL-based systems now compete with human forecasts. For description of how fuzzy logic works in nowcasting systems, see: Intelligent Weather Systems, http://www.rap.ucar.edu/technology/iws 1. Richard Wagoner, 2001: Background briefing on post processing data fusion technology at NCAR, online presentation, http://www.rap.ucar.edu/general/press/presentations/wagoner_21feb2001.pdf 2. John K. Williams, 2004: Introduction to Fuzzy Logic as Used in the NCAR Research Applications Program, Artificial Intelligence Methods in Atmospheric and Oceanic Sciences: Neural Networks, Fuzzy Logic, and Genetic Algorithms, Short Course, American Meteorological Society, 10-11 January 2004, Seattle, WA. ftp://ftp.rap.ucar.edu/pub/AMS_AI_ShortCourse/Williams_AMS_ShortCourse_11Jan2004.pdf
Case-Based Reasoning Meteorological view: CBR = analog forecasting AI view: CBR = retrieval + analogy + adaptation + learning 1 CBR is a way to avoid the “knowledge acquisition problem.” CBR is very effective in situations “where the acquisitionof the case-base and the determination of the features is straightforward compared with the task of developing thereasoning mechanism.” 2 CBR and analog forecasting recommended when models are inadequate, e.g., for ceiling and visibility, sub-NWP-grid scale, which are strongly determined by local effects. 1. Leake, D. B., 1996: CBR in context. The present and future; in Leake, D. B. (editor), Case-Based Reasoning: Experiences, Lessons & Future Directions, American Association for Artificial Intelligence, Menlo Park California, USA, 3-30. 2. Cunningham, P., and Bonzano, A., 1999: Knowledge engineering issues in developing a case-based reasoning application, Knowledge-Based Systems, 12, 371-379.
k-Nearest Neighbor(s) Technique: k-nn Definition: “For a particular point in question, in a population of points, the k nearest points.” 1 Intuition: The closer the neighbors, the more useful they are for prediction. “It is reasonable to assume that observations which are close together (according to some appropriate metric) will have the same classification. Furthermore, it is also reasonable to say that one might wish to weight the evidence of a neighbor close to an unclassified observation more heavily than the weight of another neighbor which is at a greater distance from the unclassified observation.” 2 k-nn is a basic CBR method. Commonly used to explain an observationwhen there is no other more effective method. 2 1. Dudani, S. A., 1976: The distance-weighted k-nearest neighbor rule, IEEE Transactions on Systems, Man, and Cybernetics, Volume SMC-6, Number 4, April 1976, 325-327.2. Aha, D. W. (1998) Feature weighting for lazy learning algorithms. In Liu, H. and Motoda, H. (Eds.), Feature Extraction, Construction, and Selection: A Data Mining Perspective. Norwell MA, Kluwer.
Fuzzy k-Nearest Neighbor(s) Technique: fuzzy k-nn Definition: “Nearest neighbor technique in which the basic measurement technique is fuzzy. 1 Two improvements to k-nn technique by using fuzzy k-nn approach: 1 • “Improve performance of retrieval in terms of accuracy because of avoidance of unrealistic absolute classification.” • “Increase the interpretability of results of retrieval because the overall degree of membership of a case in a class that provides a level of assurance to accompany the classification.” 1. Keller, J. M., Gray, M. R., and Givens Jr., J. A., 1985: A fuzzy k-nearest neighbor algorithm, IEEE Transactions on Systems, Man, and Cybernetics, Vol. 15, No. 4, 258-263.
“Weather Prediction 101” (for “data miners”) • Two basic methods to predict weather: 1 • Dynamical approach - based upon equations of the atmosphere, uses finite element techniques, and is commonly referred to ascomputer modeling or numerical weather prediction (NWP). • Empirical approach - based upon statistical theory and often, implicitly, the “analog principle”: similar weather situationslead to similar outcomes • In practice, hybrid methods are used to predict weather. • Statistical methods infer estimated expected distributions under specified conditions. Theoretical distributions are fit to sparse data. • Resampling methods are an option when data sets are large, and when condition specification is deferred to the last minute (run time, time-zero). 1. Lorenz, E. N., 1969: Three approaches to atmospheric predictability, Bulletin of the American Meteorological Society, 50, 345-349.
Resampling • “Resampling techniques are computationally expensive techniques that reuse the available sample to make statistical inferences. Because of their computational requirements these techniques were infeasible at the time that most of ‘classical’ statistics was developed. With the availability of ever faster and cheaper computers, their popularity has grown very quickly in the last decade.” 1 • Applicability for aviation forecasting • Rather than pre-compile probabilities of future weather categories based on outcomes of pre-selected categories of past weather cases, assuming that the pre-selected categories will closely resemble actual future weather cases, • at run-time, compile probabilities of future weather values based on the outcomes of specific past cases most similar to the specific present case, and weight each similar past cases according to its degree of similarity with the present case. 1. A.J. Feelders, 1999: Statistical Concepts, in: Intelligent Data Analysis: An Introduction, M. Berthold and D.J. Hand (eds.), Springer, Berlin, pp.15-66.
Motivation for fog prediction research: Increase safety Crash of Air Canada Flight 646 1 • 23h48, 16 Dec.1997, Fredericton • Weather: wind calm, visibility ¼ SM in fog, vertical visibility 100 feet, temperature -8C, dew point -8C, remarks 8/8 sky coverage in fog. • Fog complicated landing and delayed rescue. • 39 passengers and 3 crew members, 9 were seriously injured and the rest received minor or no injuries. 1. Aviation Occurrence Report, Loss of Control on Go-around (Rejected Landing), Air Canada Canadair CL-600-2B19 C-FSKI, Transportation Safety Board of Canada. http://www.tsb.gc.ca/en/reports/air/1997/a97h0011/a97h0011.asp
Motivation for fog prediction research: Increase safety Crash of Air Canada Flight 646 1 1. Aviation Occurrence Report, Loss of Control on Go-around (Rejected Landing), Air Canada Canadair CL-600-2B19 C-FSKI, Transportation Safety Board of Canada. http://www.tsb.gc.ca/en/reports/air/1997/a97h0011/a97h0011.asp
Flight delay causes 1 Weather-related delays • In some places, fog is main cause of weather-related delays. 2 • At one airport alone, fog-related delays caused over $3M US in annual operating expenses. 3 1. Anonymous, 2000: A jam at 32,000 feet. The Economist. February 5, 2000. 2. Allan, S. S., Gaddy, S. G., and Evans, J. E., 2001: Delay causality and reduction at the New York City airports using terminal weather information systems, Lincoln Laboratory, Massachusetts Institute of Technology, Lexington, Mass. http://www.ll.mit.edu/AviationWeather/atc-291.pdf 3. Robinson, Peter J., 1989: The Influence of Weather on Flight Operations at the Atlanta Hartsfield International Airport. Weather and Forecasting: Vol. 4, No. 4, pp. 461-468.
Average number of days with fog at Canadian airports 1 1. David Phillips, 1990: The Climates of Canada, Canada Communications Group-Publishing.
Aviation forecast service client needs Clients need accurate forecasts to intelligently – strategically and safely and economically – manage air traffic and to determineamounts of fuel to load aboard individual airplanes. • Low ceilings and visibility reduce landing rates at airports. When low conditions are forecast, extra fuel is loaded, to extend range, in case a plane must divert from destination to alternate airport. Flight plans must include “alternates.” • Carrying extra fuel is expensive: transporting the fuels costs money, and the weight of the extra fuel reduces the amount of cargo that can be transported. • Accuracy of forecasts is mainly determined by ceiling and visibility, and fog often causes reduced visibility.
Aviation forecast service client needs Every 1% increase in TAF accuracy would result in $1M per year of value to the air traffic system in Canada – estimating conservatively, and assuming increase relative to recently measured levels of TAF accuracy. 1 Savings would result from: • Reduced fuel burn or payload substitution, ~ 60% of the total potential saving; • Fewer diversions, ~ 30% of the total benefit; • Fewer fuel stops, ~ 10 percent of potential saving. 1. Assessment of Aerodrome Forecast (TAF) Accuracy Improvement, NAV CANADA, May 2002, pg. 22.
Search and Rescue concern: “Where is the fog?” 1 • The majority of military aviation operating out of Greenwood consists of Maritime Patrol and SAR activities, primarily using large turbo-prop aircraft, and to a lesser extent helicopters. Fog has a significant impact on each phase of these operations, often in a way that's somewhat different than commercial passenger operations. • Both the Patrol and SAR activities spend a significant part of many missions at low level over the water. They need to be able to see, both for the visual aspects of identifying vessels and surface activity, and simply the safety of operation. Missions may be 6-10 hours in length and cover relatively large areas. Although for “operational” missions they may have little option as to the area over which they operate, they spend a lot of time training and can often select an area based on weather and other factors. Aircraft time is very expensive so they need to make maximum use of resources. Thus they have a strong interest in the extent of fog, changes in its coverage over time and space etc. 1. Bob Howell, 2004: Personal communication.
Search and Rescue concern: “Where is the fog?” 1 • Helicopters with their limited range can face particular challenges. For SAR operations at extended distance from shore, the helicopter crew may opt to use Sable Island or an oil platform for refuelling on the return trip. Even though they have electronic navigation aids to help them find that refuelling point, they still need to see the last few tens or hundreds of feet in order to land. If unexpected fog prevents them from finding the refuelling spot in time they could run out of fuel or collide with an object on the surface while attempting to land. • There have been instances in which a SAR helicopter was tasked to lift a sick or injured crewman from a vessel operating in fog and, with the help of the meteorologist looking a satellite image, was able to direct the vessel to a clear spot where the two could meet visually. Obviously a knowledge of movements or changes in fog areas is of considerable interest in these kinds of missions. 1. Bob Howell, 2004: Personal communication.
Search and Rescue concern: “Where is the fog?” 1 • Fog impacts takeoff and landing in a way somewhat similar to commercial operations. If fog reduces visibility to below required limits for takeoff but there is improvement anticipated, the aircraft will often start and hold near the end of the runway a little before the expected improvement. Obviously this uses fuel, adds to crew fatigue and impacts on the available time for training or the operational mission. If improvement is early, a potential window of good training or mission time may be lost. If improvement is significantly late, resources are likewise wasted in waiting. • Just like commercial aircraft, military crews dislike having to land at a location other than the one originally planned. The cost of a night away from home for an aircraft and 10-person crew is significant, and the aircraft is not available for use in other training or operations. So diverting due to unforecast fog is a very negative occurrence, and crews will go to considerable lengths to avoid it. 1. Bob Howell, 2004: Personal communication.
Motivation for ceiling and visibility prediction research Economics and Efficiency • The commonest cause for TAFs needing to be amended is the occurrence of unforecast categories of cloud ceiling and visibility. 1 • Production of TAF’s accounted for about $5M per year in revenue to Environment Canada from Nav Canada in 1999. 2 • The NWS estimates that a 30 minute lead-time for identifying cloud ceiling or visibility events could reduce the number of weather-related delays by 20 to 35 percent and that this could save between $500 million to $875 million annually. 3 • “The economic benefit of a uniform, hypothetical increase in TAF accuracy of 1% is approximately $1.2 million [Australian] per year for Qantas Intl. flights into Sydney.” 4 1. Henry Stanski, 1999: Personal communication. 2. Ken Macdonald, 1999, personal communication. 3. Jim Valdez, NWS Reinventing Goals for 2000, http://govinfo.library.unt.edu/npr/library/announc/npr5.htm 4. Leigh, R. J., 1995: Economic benefits of Terminal Aerodrome Forecasts (TAFs) for Sydney Airport, Australia, Meteorological Applications, 2, 239-247.
Motivation for AI-based ceiling and visibility prediction research Scientific and Engineering Challenge • Ceiling and visibility are sub-grid scale, “not resolvable” with NWP. “Unfortunately, cloud cover is the most difficult of meteorological variables for numerical models to predict. [MOS] output for predictions of ceiling and visibility is heavily dependent on the most recent station observations rather than the output of the numerical model. Consequently, the quality of ceiling and visibility forecasts has not increased as it has for other forecast variables. For 3- and 6-hour forecasts, several studies have shown that local forecasters could not do better and often did worse than persistence. MOS forecasts were not clearly better than those of the local forecaster for time frames of 9 hours or less.” 1 • Classical statistical (non k-nn) C&V prediction systems R&D since 1970, but none are used operationally (unlike for, e.g., temperature forecasts), based on review of ~ 80 articles; 2 US and Netherlands have new “semi-operational” systems. 3, 4 1. The COMET Outreach Program, http://www.comet.ucar.edu/outreach/9915808.htm2. Ceiling and visibility articles, http://chebucto.ca/Science/AIMET/cva 3. Thomas Hicks, Ted Crawford, and Matthew Wilson, 2003: A fuzzy logic system for automated short term aviation weather forecasts, 3rd Conference on Artificial Intelligence, American Meteorological Society. 4. Albert Jacobs, 1998: First Guess TAF - FGTAF, Semi-automation in TAF production, Applications and Modelling Division KNMI.
Limitation in Current Objective Ceiling and VisibilityForecasting Systems Assumption that present weather can be adequately described by using preselected samples and memberships of attributes in predefined categories. Current systems, both analog based and rule based, are based onthe assumption that airport weather data can only be represented andprocessed indirectly according to categories. Current systems use: 1 • Prior probability based treatment of situations; • Category based treatment of variables. 1. Clarke 1995, Garner 1995, Gollvik and Olsson 1993, Keller et al. 1995, Kilpinen 1993, Kumar et al. 1994, Ling 2002, Meyer 1995, Porter and Seaman 1995, Shakina et al. 1993, Warner and Stoelinga 1995, Vislocky and Fritsch 1997, Whiffen 1993, Wilson and Sarrazin 1989.
Category based treatment of variables • Does not intuitively reflect degree of similarity between cases; • Attempt to compensate by using finer categories may result in yield “no past event” upon which to base a prediction. Category Prior probability based treatment of situations • Limits specificity of the situation description. Not practical to calculate prior probabilities of outcomes of a specific situation such as:July 10th, 6 am, ceiling height 100 feet, wind southerly 5 km/h, wind shift three hours hence to westerly 15 km/h • Too many possible combinations to account for before the actual event.
288 binsPredictions based on about0.3% most similar cases Output: Probabilities of pre-selected ceiling and visibility categories. Input: Station: St. John’s, Date: Jan. 15, Wind 045/15, Weather: Snow Output: C0-C1C2-C4C5-C9C10-C24C25- Ceilings 0.7% 19.3% 52.1% 21.7% 6.2%0-3/81/2-3/41-21/23-56- Vsbys 4.7% 26.0% 30.9% 14.6% 23.8% Note:U-shapeddistribution STATAV Climatological information from specific airports. 1 Input: wind speed - 3 categories wind direction - 8 directions precipitation type - 3 types season - 4 seasons 1. Whiffen, B., 1993: FTGEN - An automated FT production system, 5th International Conference on Aviation Weather Systems, American Meteorological Society, 327-330.
Design tight fit for critical elements, such as wind direction, relatively loose fit for others, such as temperature. An expert forecaster suggests values that correspond to varying degrees of similarity. Fuzzy similarity-measuring function Three types of fuzzy operations designed to measuredegree of similarity between three types of attributes. 1. Continuous. (e.g., wind direction, temperature, etc.)
Expertly configured similarity-measuring function Expert specifies thresholds for various degrees of near
8 4 0 Calm to lights wind speedsrequire special interpretation. 0 4 8 Fuzzy similarity-measuring function 2. Magnitude. (e.g., wind speed) FuzzyDecisionSurface
Different types of weather havedifferent perceiveddegrees of similarity. Fuzzy similarity-measuring function 3. Nominal. (e.g., precipitation) Fuzzy Relationships
Prediction To synthesize probabilistic forecasts, we make 11 series of deterministic forecasts based on percentiles of C&V in analogs(0, 10, 20, ..., 100): 0%ile is the lowest C&V, 50%ile is the median, 100%ile is the highest. Using MSC / Nav Canada performance measures, experimentsshowed that the series in the 20 to 40 range verified fairly well. Be aware of systematic tradeoffs between Frequency of Hits,False Alarm Ratio, and Probability of Detection, e.g., IFR POD and FAR VFR POD and FAR
Prediction Forecast: ceiling and visibility based on 30%ile of analogs