Download
1 / 18
250 likes | 786 Vues
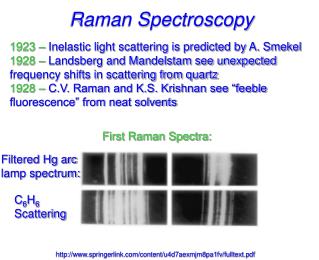
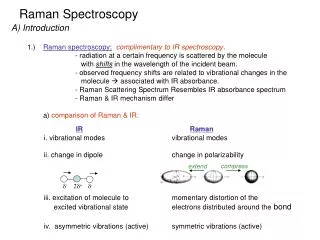
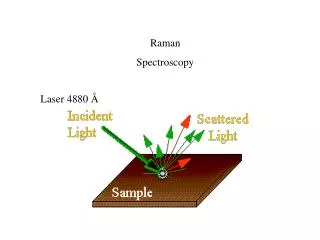
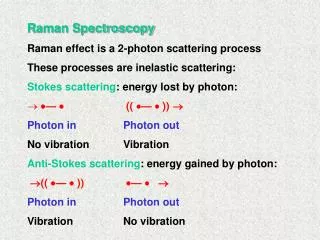
Raman Spectroscopy Raman effect is a 2-photon scattering process These processes are inelastic scattering: Stokes scattering : energy lost by photon: — (( — )) Photon in Photon out No vibration Vibration Anti-Stokes scattering : energy gained by photon:

E N D
Raman Spectroscopy • Raman effect is a 2-photon scattering process • These processes are inelastic scattering: • Stokes scattering: energy lost by photon: • — (( — )) Photon in Photon out No vibration Vibration • Anti-Stokes scattering: energy gained by photon: (( — )) — Photon in Photon out Vibration No vibration
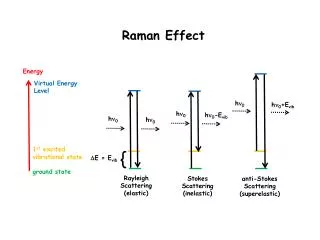
But dominant process is elastic scattering: • Rayleigh scattering • — — Photon in Photon out No vibration No vibration If incident photon energy E; vibration energy v, then in terms of energy, photon out has energy: E-v Stokes scattering E+v anti-Stokes scattering E Rayleigh scattering
Representation in terms of energy levels: Arrow up = laser photon in; Arrow down = Raman scattering out
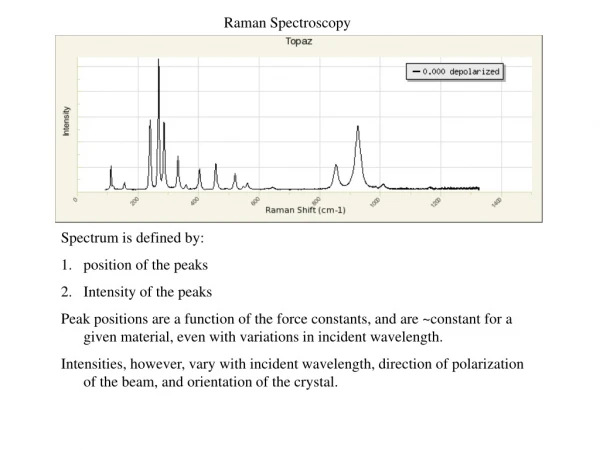
Typical Raman spectrum Plot of signal intensity vs Raman shift (Raman shift, in cm-1 = energy of photon in-energy of photon out) shows 3 vibrations of octahedral BiCl63-
Selection rule for Raman spectrum Vibration is active if it has a change in polarizability, . Polarizability is the ease of distortion of a bond. For Raman-active vibrations, the incident radiation does not cause a change in the dipole moment of the molecule, but instead a change in polarizability. In starting the vibration going, the electric field of the radiation at time t, E, induces a separation of charge (i.e. between the nuclear protons and the bonding electrons). This is called the induced dipole moment, P. (Don’t confuse it with the molecule’s dipole moment, or change in dipole moment, because this is often zero). P = E
Example: There are 4 normal modes of CO2. Only 1 is Raman active • is dipole moment; • is polarizability; Q is vibration coordinate, The slopes are measured at Q = 0 (I.e. at the equilibrium position). Change in dipole moment, , and polarizability, , during CO2 vibrations 1 3
Uses of Raman Spectroscopy Raman spectroscopy has become more widely used since the advent of FT-Raman systems and remote optical fibre sampling. Previous difficulties with laser safety, stability and precision have largely been overcome. Basically, Raman spectroscopy is complementary to IR spectroscopy, but the sampling is more convenient, since glass containers may be used and solids do not have to be mulled or pressed into discs.
Applications of Raman spectroscopy Qualitativetool for identifying molecules from their vibrations, especially in conjunction with infrared spectrometry. Quantitative Raman measurements a) not sensitive since Raman scattering is weak. But resonance Raman spectra offer higher sensitivity, e.g. fabric dyes studied at 30-50 ppb. b) beset by difficulties in measuring relative intensities of bands from different samples, due to sample alignment, collection efficiency, laser power. Overcome by using internal standard.
Raman and fluorescence spectra The diagram shows some of the energy levels of the uranyl ion. UO22+ 20000 cm-1 Energy ___________ 800 cm-1 ___________ 0 cm-1 The vibrational level at 800 cm-1 is the totally symmetric stretch. The electronic levels are fairly continuous above 20000 cm-1. What happens if you excite with a laser at (a) 15000 cm-1? (b) 21000 cm-1? (c) 22000 cm-1?
Raman vs IR spectroscopy RAMAN IR Sample preparation usually simpler Liquid/ Solid samples must be free from dust Biological materials usually fluoresce, masking scattering Spectral measurements on vibrations Halide optics must be used- made in the visible region-glass cells expensive, easily broken, may be used water soluble Depolarization studies are easily made IR spectrometers not usually (laser radiation almost totally linearly equipped with polarizers polarized)
More about polarizability , polarizability of molecule, related to mobility of electrons (under applied radiation field in our present case). For atoms, same distortion is obtained for field in any direction. Polarizability is Isotropic For many molecules, polarizability depends on direction of applied field, e.g. H—H easier to distort along bond than bond. Polarizability is anisotropic Variation of with direction is described by polarizability tensor.
Calculation of Stokes and anti-Stokes intensity ratio The Raman spectrum was taken at 300 K using 1064 nm Nd-YAG radiation. Check the intensity ratio of the 1features at 278.5 cm-1. What can you say about the intensity ratio of the band at 112 cm-1?
Instrumentation Dispersive Raman instruments Laser Sample Double or triple monochromator signal processing and output Photomultiplier tube The monochromators are required to separate the weak Raman signal from the intense, nearby Rayleigh scattering. Typical lasers are Ar+ (e.g. green line, 514.5 nm) or Kr+ (e.g. yellow line, 530.9 nm).
Fourier transform Raman spectrometer The Raman instrument can be on the same bench as the FTIR. Often, a YAG:Nd3+ laser (1064 nm) is used to excite the sample, so that the excitation energy is lower than the absorption band energies of organic systems. Fluorescence is then minimized. Instruments may be combined with a microscope, or optical fibre, so that scanning over a few (microns)2 of surface area, and Raman mapping is easily performed.
Sampling techniques for Raman spectroscopy If the sample is colourless, it does not absorb a visible laser Raman spectroscopy is applicable to solids, liquids or gases. Gases: use gas cell
Liquids and solids can be sealed in a glass capillary: If the compound is colored, it can absorb the laser, get hot and decompose. Some techniques are: • Reduce the laser power (defocus) and/or change wavelength; • Dilute the sample into a KBr pellet; • Cool the sample • Rotate or oscillate the laser beam on the sample
Number of bands in a Raman spectrum As for an IR spectrum, the number of bands in the Raman spectrum for an N-atom non-linear molecule is seldom 3N-6, because: polarizability change is zero or small for some vibrations; bands overlap; combination or overtone bands are present; Fermi resonances occur; some vibrations are highly degenerate; etc…
High resolution Raman spectra can show splittings due to isotopic mass effects, for example: the 1 Raman band of CCl4 (corresponding tp the totally symmetric stretching vibration) is split into 5 components. 461.5 cm-1 is due to 35Cl4C 458.4 cm-1 is due to 35Cl337ClC 455.1 cm-1 is due to 35Cl237Cl2C What are the two question marks? Why are these bands weak?