Weather Derivatives
450 likes | 614 Vues
Weather Derivatives. Dr Harvey Stern, Victorian Regional Office. Weather Services Planning Conference Friday 19 April 10.15am-10.45am. The Noah Rule. “Predicting rain doesn’t count; Building arks does”. Warren Buffett, Australian Financial Review,11 March 2002. Outline of Presentation.

Weather Derivatives
E N D
Presentation Transcript
Weather Derivatives Dr Harvey Stern, Victorian Regional Office Weather Services Planning Conference Friday 19 April 10.15am-10.45am
The Noah Rule “Predicting rain doesn’t count; Building arks does”. Warren Buffett, Australian Financial Review,11 March 2002.
Outline of Presentation • Some recent developments in weather risk. • Applications of weather derivatives. • Utilising forecast accuracy and other databases. • Role of ensemble weather forecasting. • Recommendations to enable the BoM to keep abreast of devlopments in this growing sector of weather services.
Introduction • The meteorological community is becoming increasingly skilled at applying weather-related risk management products. • Most of these products originate from the financial markets. • It is the energy sector (in the USA) that has, so far, taken best advantage of the growing weather-risk market.
The words of O. G. Sutton “The analogy between meteorology and astronomy is often made … There is a closer resemblance, to my mind, between meteorology and economics. Both deals fundamentally with the problem of energy transformations and distribution - in economics, the transformation of labour into goods and their subsequent exchange and distribution; - in meteorology, transformation and distribution of the energy received from the sun. Both are subject to extremely capricious external influences.” (from “Mathematics and the future of meteorology”, Weather, October, 1951)
Background • The property and casualty reinsurance industry experienced several major events during the late 1980s & early 1990s. • The ensuing industry restructuring saw the creation of new risk-management tools. • These tools included securitisation of insurance risks. • A third party issues these securities. • The securities provide a return structured in a manner related to the occurrence (or otherwise) of an adverse event.
Weather Risk • Weather risk is one of the biggest uncertainties facing Australian business. - We get droughts, floods, fire, and cyclones. • Economic adversity is not restricted to disaster conditions. - A mild winter ruins a ski season, dry weather reduces crop yields, & rain shuts-down entertainment & construction. - Recently, a brewer blamed an earnings decrease on a cool summer.
Securitisation of Weather Risk • Weather securitisation may be defined as the conversion of the abstract concept of weather risk into packages of securities. • These may then be sold as income-yielding structured products.
Forecasts • Weather forecasts may be used to manage risk associated with short-term activities (e.g. pouring concrete). • Climate forecasts may be used to manage risk associated with long-term activities (e.g. sowing crops). • With the focus upon managing risk, the forecasts are increasingly being couched in probabilistic terms.
The Road toWeather Risk Management. • The era of (mostly) categorical forecasts. • The rapid increase in the application of probability forecasts. • The provision of forecast verification data. • The era of the “guaranteed forecast”, with user communities being compensated for an inaccurate prediction. • The purchase of “stakes” in the industry (by multi-national companies).
Australian Developments • For many years, the power industry has received detailed weather forecasts from the Bureau. • Now, Australia has joined the global trend towards an increased focus on the management of weather-related risk. • The first instance of an (Australian) weather derivative trade occurred about two years ago. • A number of businesses have now moved into the trading of weather risk products, almost all “over the counter”. • Partnerships between merchant banks and weather forecasting companies.
Weather-risk & the Financial Markets • Weather-linked securities have prices which are linked to the historical weather in a region. • They provide returns related to weather observed in the region subsequent to their purchase. • They therefore may be used to help firms hedge against weather related risk. • They also may be used to help speculators monetise their view of likely weather patterns.
Should Companies Worry? • In the good years, companies make big profits. • In the bad years, companies make losses. - Doesn’t it all balance out? - No. it doesn’t. • Companies whose earnings fluctuate wildly receive unsympathetic hearings from banks and potential investors.
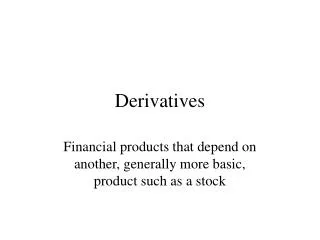
What is a Derivative? A Derivative is a financial instrument whose value is derived from the value of some other financial variable.
A Familiar Exampleof a Derivative. A familiar example of Derivatives were the TELSTRA Instalment Receipts. Their value fluctuated in accordance with fluctuations in the value of TELSTRA shares.
What is a Weather Derivative? A Weather Derivative is a financial instrument whose value is derived from the magnitude of some weather variable.
Expanding the Definition • Weather derivatives are financial instruments that are utilised to manage weather (& climate) related risk. • They are similar to conventional financial derivatives. • The basic difference lies in the underlying variables that determine the pay-offs. • These underlying variables include temperature, precipitation, wind, and heating (& cooling) degree days.
Derivative or Insurance? A Derivative: -has ongoing economic value, -is treated like any other commodity, -is accounted for daily, & -may therefore affect a company’s credit rating. An Insurance Contract: -is not regarded as having economic value, & -therefore does not affect a company’s credit rating.
Some Important Issues • Quality of weather and climate data. • Changes in the characteristics of observation sites. • Security of data collection processes. • Privatisation of weather forecasting services. • Value of data. • Climate change.
An Early Example • In 1992, the present author explored a methodology to assess the risk of climate change. • Option pricing theory was used to value instruments that might apply to temperature fluctuations and long-term trends. • The methodology provided a tool to cost the risk faced (both risk on a global scale, and risk on a company specific scale). • Such securities could be used to help firms hedge against risk related to climate change.
Another Example • A common example is the Cooling Degree Day (CDD) Call Option. • Total CDDs in a season is defined as the accumulated number of degrees the daily mean temperature is above a base figure. • This is a measure of the requirement for cooling. • If accumulated CDDs exceed “the strike”, then the seller pays the buyer a certain amount for each CDD above “the strike”.
Specifying the CDD Call Option • Strike: 400 CDDs. • Notional: $100 per CDD (> 400 CDDs). • If, at expiry, the accumulated CDDs > 400, the seller of the option pays the buyer $100 for each CDD > 400.
Approaches to Pricing • Historical simulation. • Direct modeling of the underlying variable’s distribution. • Indirect modeling of the underlying variable’s distribution (via a Monte Carlo technique).
Significant Long-term Trends • Some weather elements have trended significantly. • Trends need to be considered when valuing weather securities (such as CDD Call Options). • The trend in the minimum temperature at Melbourne (Australia) is shown here.
Cooling Degree Days (1855-2000) • The chart shows frequency distribution of annual accumulated Cooling Degree Days at Melbourne using all data:
Cooling Degree Days (1971-2000) • The chart shows frequency distribution of annual accumulated Cooling Degree Days at Melbourne using only recent data:
Pricing the CDD Call Option • The two CDD frequency distributions are quite different. • Utilising the different data in valuation results in different prices. • Utilising 1855-2000 data yields a price thus: $(.051x2500+.045x7500+.008x12500)= $565.00 • Utilising 1971-2000 data yields a price thus: $(.238x2500+.119x7500+.029x12500)= $1850.00 • The more recent frequency distribution should provide a more relevant result.
An Option linked to a Climate Index • Suppose we define a rainfall put option, to apply when the Southern Oscillation Index (SOI) is in the lowest three deciles. • Location: Echuca. • Strike: Decile 4. • Notional: $100 per decile below Decile 4. - If, at expiry, the rainfall Decile is less than 4, then the seller of the option pays the buyer $100 for each Decile below 4.
Rainfall Distribution • To value the put option one uses data giving actual distribution of rainfall for cases when the SOI is in the lowest 3 deciles.
Evaluating the Decile 4 Put Option • 9 cases of Decile 1 yields $(4-1)x9x100=$2700 • 6 cases of Decile 2 yields $(4-2)x6x100=$1200 • 4 cases of Decile 3 yields $(4-3)x4x100=$400 • The other 25 cases (Decile 4 or above) yield nothing. …leading to a total of $4300, and an average contribution of $98, which is the price of our put option. • Later, a catastrophe bond, which may be issued to provide protection in the case of drought, will be described.
Impact of Forecasts • When very high temperatures are forecast, there may be a rise in electricity prices. • The electricity retailer then needs to purchase electricity (albeit at a high price). • This is because, if the forecast proves to be correct, prices may “spike” to extremely high (almost unaffordable) levels.
Impact of Forecast Accuracy • If the forecast proves to be an “over-estimate”, however, prices will fall back. • For this reason, it is important to take into account forecast verification data in determining the risk.
Using Forecast Verification Data • Suppose we define a 38 deg C call option (assuming a temperature of at least 38 deg C has been forecast). • Location: Melbourne. • Strike: 38 deg C. • Notional: $100 per deg C (above 38 deg C). • If, at expiry (tomorrow), the maximum temperature is greater than 38 deg C, the seller of the option pays the buyer $100 for each 1 deg C above 38 deg C.
Determining the Price of the38 deg C Call Option • Between 1960 and 2000, there were 114 forecasts of at least 38 deg C. • The historical distribution of the outcomes are examined.
Evaluating the 38 deg C Call Option (Part 1) • 1 case of 44 deg C yields $(44-38)x1x100=$600 • 2 cases of 43 deg C yields $(43-38)x2x100=$1000 • 6 cases of 42 deg C yields $(42-38)x6x100=$2400 • 13 cases of 41 deg C yields $(41-38)x13x100=$3900 • 15 cases of 40 deg C yields $(40-38)x15x100=$3000 • 16 cases of 39 deg C yields $(39-38)x16x100=$1600 cont….
Evaluating the 38 deg C Call Option (Part 2) • The other 61 cases, associated with a temperature of 38 deg C or below, yield nothing. • So, the total is $12500. • This represents an average contribution of $110 per case, which is the price of our option.
A Forecast Error Put Option(defining error as predicted minus observed) • Strike: 0 deg C. • Notional: $100 per degree of forecast error below 0 deg C • If the forecast underestimates the actual temperature, then the seller of the option pays the buyer $100 for each 1 deg C of underestimation. - Historical simulation yields a suggested price of $67 for our put option.
Particularly Australian Applications • Purchase of put contracts to protect against reduced rainfall, by a generator of hydroelectricity. • Purchase of call contracts to protect against a sequence of very hot days. • Purchase of variable degree day contracts to protect against very high temperatures. • Purchase of guaranteed yield contracts (based on relationships between wheat yield & rainfall and temperature).
Ensemble Forecasting • In order to obtain a measure of forecast uncertainty, there is an alternative to using historical forecast verification data. • This is to use ensemble weather forecasts • Ensemble weather forecasts are derived by imposing a range of perturbations on the initial analysis. • Uncertainty associated with the forecasts may be derived by analysing the probability distributions of the outcomes.
Concluding Remarks • The sophistication of weather-related risk management products is growing. • Australia has joined this new market. • In evaluating weather securities, one may use a variety of data types, and take into account climate trends. • Ensemble forecasting is an alternative approach to determining forecast uncertainty.
Recommendations • In order to keep abreast of developments in this growing sector of weather services… - That the BoM join the Weather Risk Management Association. - That the BoM be represented at risk management conferences. - That the BoM develop a program of research into weather risk management. - That the BoM subscribe to a variety of risk management journals.