
Molecular Mechanisms of Salt Stress Tolerance in Actinorhizal Symbiosis
Salinization of soils and groundwater is a serious problem leading to reduced agricultural production. Actinorhizal plants, such as Casuarina trees, form a symbiotic association with the actinobacteria Frankia to tolerate salt stress. This study aims to identify salt-tolerant Frankia strains and their responsible genes for salt tolerance mechanisms. Preliminary results are uncovering the salt stress tolerance mechanisms in Frankia. The research is supported by various institutions. Salt stress tolerance levels in Frankia strains were determined using a 24-well growth assay. RNA sequencing and gene expression analyses were conducted to understand the molecular responses to salt and osmotic stresses. Amino acid profiles were evaluated under stress conditions. These findings contribute to understanding how actinorhizal plants survive in harsh environments.

Molecular Mechanisms of Salt Stress Tolerance in Actinorhizal Symbiosis
E N D
Presentation Transcript
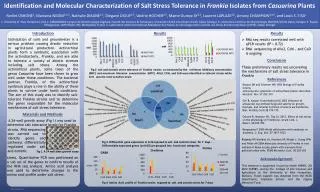
Salinization of soils and groundwater is a serious problem causing drastic reduction in agricultural production. Actinorhizal plants form a symbiotic association with the actinobacteria, Frankia, and are able to tolerate a variety of abiotic stresses including salt stress. Among the actinorhizal plants, some trees of the genus Casuarina have been shown to grow well under these conditions. The bacterial partner, Frankia, of the actinorhizal symbiosis plays a role in the ability of these plants to survive under harsh conditions. The aim of this study was to identify salt-tolerant Frankia strains and to determine the genes responsible for the molecular mechanisms of salt stress tolerance. References These preliminary results are uncovering the mechanisms of salt stress tolerance in Frankia Introduction Results RNA seq results correlated well with qPCR results (R2 = 0.72) RNA sequencing of Allo2, CcI6 , and CeD is ongoing Ridgway KP, Marland LA, Harrison AF, Wright J, Young JPW and Fitter AH 2004 Molecular diversity of Frankia in root nodules of Alnusincana grown with inoculum from polluted urban soils. FEMS Microbiol. Ecol. 50 255–263 Conclusion Results Acknowledgement This research is supported in part by Hatch NH585, JGI 2012 CSP585, and by the College of Life Sciences and Agriculture at the University of New Hampshire, Durham. Travel support was obtained from the MCBS department, Graduate School, and the Zsigray Memorial Fund. Rediet OSHONE1, Mariama NGOM2,3,5, Nathalie DIAGNE3,5, Diegane DIOUF3,5, Valérie HOCHER4,5, MameOureyeSY2,5, Laurent LAPLAZE4,5, Antony CHAMPION3,4,5, and Louis S. TISA1 Identification and Molecular Characterization of Salt Stress Tolerance inFrankia Isolates from Casuarina Plants Materials and Methods A 24-well growth assay (Fig 1) was used to determine salt tolerance levels for Frankia 1. University of New Hampshire, USA 2. Laboratoire Campus de Biotechnologie Végétale, Faculté des Sciences & Techniques, Université Cheikh AntaDiop (UCAD), Dakar, Sénégal 3. Laboratoire Commun de Microbiologie IRD/ISRA/UCAD, Dakar, Sénégal 4. Equipe Rhizogenèse, UMR DIADE, IRD, Montpellier, France 5. Laboratoire mixte international Adaptation des Plantes et microorganismes associés aux Stress Environnementaux (LAPSE), Dakar, Sénégal Fig 2 salt and osmotic stress tolerance of Frankia strains as measured by the minimum inhibitory concentration (MIC) and maximum tolerance concentration (MTC). Allo2, CCI6, and CeD were identified as tolerant strains while CcI3 was the most sensitive strain Benson DR and Silvester WB 1993 Biology of Frankia strains, actinomycetesymbionts of actinorhizal plants. Microbiol. Mol.Biol. Rev. 57 293–319 GiriB, Kapoor R and Mukerji KG 2003 Influence of arbuscularmycorrhizal fungi and salinity on growth, biomass, and mineral nutrition of Acacia auriculiformis. Biol. Fertility Soils 38 170–175 OshoneR, Mansour SR, Tisa LS. 2013. Effect of salt stress on the physiology of Frankia sp. strain CcI6. J. Biosci. 38:699–702 RengasamyP 2006 World salinization with emphasis on Australia. J. Exp. Bot. 57 1017–1023 strains. RNA sequencing was carried out to identify genes and pathways differentially regulated under salt and osmotic Fig 3. Differential gene expression in CcI3 exposed to salt and osmotic stress for 7 days . Differentially expressed genes (p<0.05) are grouped into functional categories. Fig 1. A 24 well plate growth assay stress. Quantitative PCR was performed on a sub set of the genes to confirm results of the RNA seq analysis. Amino acid analysis was used to determine changes in the amino acid profile under salt stress . Fig 4 Amino Acid profile of Frankia strains exposed to salt and osmotic stress for 7 days


