CHAPTER 1 STATISTICS
CHAPTER 1 STATISTICS. Statistics is a way of reasoning, along with a collection of tools and methods, designed to help us understand the world. READ THE BOOK. Think Show Tell For Example Step-by-Step What can go wrong* What have we learned?. CHAPTER 2 DATA.


CHAPTER 1 STATISTICS
E N D
Presentation Transcript
CHAPTER 1STATISTICS Statistics is a way of reasoning, along with a collection of tools and methods, designed to help us understand the world
READ THE BOOK • Think • Show • Tell • For Example • Step-by-Step • What can go wrong* • What have we learned?
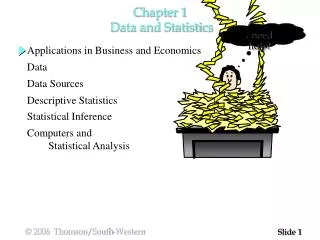
CHAPTER 2DATA • Information together with its context • Numerical • Names • Labels • Five W’s • Who, What, When, Where, Why • How
WHO • Respondents: Individuals who answer a survey • Subjects or Participants: People on whom we experiment. (Experimental Units) • Records or Cases: Rows in a database or data table. Individuals about whom or about which, we have the data.
WHAT • Variables • Characteristics recorded about each individual. These are usually columns in a data table, and they should have a name that identifies what has been measured. • Categorical (or Qualitative) • Quantitative (Numerical values with measurement units) • Ordinal
…more W’s • Where and When? • Country? Year? • How? • How the data was collected? • Why? • Reason for the study
Exercise • Investments. According to an article in Fortune (Dec.28, 1992), 401(K) plans permit employees to shift part of their before-tax salaries into investments such as mutual funds. Employers typically match 50% of the employees’ contribution up to about 6% of salary. One company, concerned with what it believed was a low employee participation rate in its 401(k) plan, sampled 30 other companies with similar plans and asked for their 401(k) participation rates.
Identify the W’s • Who ? • 30 Companies • What ? • Participation Rates • Quantitative (Units : Percent) • When ? • Sometime after 1992
Identify the W’s (cont.) • Where ? • USA • Why ? • The company was concerned with its participation rate compared with other companies • How ? • Companies were sampled using an unspecified method
Exercise • Flowers. In a study appearing in the journal Science a research team reports that plants in southern England are flowering earlier in the spring. Records of the first flowering dates for 385 species over a period of 47 years indicate that flowering has advanced an average of 15 days per decade, an indication of climate warming according to the authors.
Identify the W’s • Who ? • 385 species of flowers over 47 years • What ? • First flowering date • Quantitative (Units : days) • When ? • Not specified
Identify the W’s (cont.) • Where ? • Southern England • Why ? • Researchers associate this behavior with climate warming • How ? • Observation. ( Method not specified)
Chapter 3. Displaying and Describing Categorical Data • Make a picture • First Make piles • Organize the counts by categories in a frequency table (counts) or a relative frequency table (percentages) • Both types of tables describe the distribution of the categorical variable because they name the possible categories and tell how frequently each occurs
The Area Principle • The area occupied by a part of the graph. It should correspond to the magnitude of the value it represents
Bar Charts • A bar chart displays the distribution of a categorical variable, showing the counts for each category next to each other for easy comparison.
Pie Charts • Relative proportion (percentages instead of counts). • Pie charts show the whole group of cases as a circle, each of the pieces has a size proportional to the fraction of the whole in each category.
Contingency Tables • Two categorical variables
Marginal and Conditional distributions • Marginal Distribution • Distribution of either variable alone (at the margin of the table) • Conditional Distribution • A distribution in one variable for only those individuals satisfying some condition on another variable. • Note : If the distribution of one variable is the same for all categories of another we say that the variables are independent.
Exercises • Step-by-Step page 31 • What can go wrong • Check the charts on pages 34 • Simpson’s Paradox (page 35)