Understanding Box and Whisker Plots: A New Graphing Method in Mathematics
Today's lesson focuses on the box and whisker plot, a graphical representation used to display data, including the range, median, and quartiles. This technique offers a concise overview of data distribution, making it more informative than merely reporting the median, yet less elaborate than a histogram. Through hands-on activities, students will create their own human box and whisker plots using personal data like height, age, and shoe size to visually demonstrate and analyze these statistical concepts in a fun and engaging way.

Understanding Box and Whisker Plots: A New Graphing Method in Mathematics
E N D
Presentation Transcript
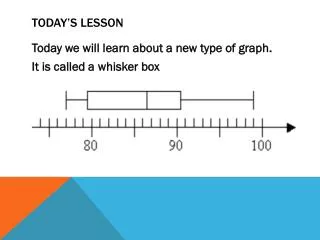
Today’s Lesson • Today we will learn about a new type of graph. • It is called a whisker box
TAKE Some Notes • Box and whisker plots • A box and whisker plot is used to display information about the range, the median and the quartiles. It is usually drawn alongside a number line
Whisker Box is a type of graph FIVE POINT SUMMARY More detailed than reporting only median, but less detailed than showing a histogram or stem & leaf diagram, is the FIVE NUMBER SUMMARY
Example #1: • Example • The oldest person in Mathsminster is 90. The youngest person is 15. • The median age of the residents is 44, the lower quartile is 25, and the upper quartile is 67. • Represent this information with a box-and-whisker plot. • Solution
Class Activity • You have three post-its • Write your name on each • Use one to records your • Height • Age in Months • Shoe Size
Human Whisker Box Plot! • Now that we have our data we are going to create a human whisker box. • Lets use our height data first! • Line up in order from least to greatest. • Lets find the Median • Now separate the Upper and Lower halves of the data • Let’s find the middle of the lower half. • This is the lower quartile • Now we will find the middle of the upper half. • This is the upper quartile • 6. Time to identify the upper and lower extremes.
Let’s Try one more time • Now that we have our data we are going to create a human whisker box. • Lets use our ages in month next ! • Line up in order from least to greatest. • Lets find the Median • Now separate the Upper and Lower halves of the data • Let’s find the middle of the lower half. • This is the lower quartile • Now we will find the middle of the upper half. • This is the upper quartile • 6. Time to identify the upper and lower extremes.
Champs For Work Time • C- Voice Level 1 • H- Do your best thinking. Raise hand for assistance • A- Use the Shoe size data create a Box and Whisker Plot of the data • M- You may choose a seat with your partner • P- Complete the Box and Whisker plot of data. When you are down turn in paper to finished work basket. Complete practice problems in textbook. P. 82
Lesson Wrap-UP • Pre Algebra Upgrade
Champs for Classwork • C- Voice Level 1 Talk about Math • H- Do your best thinking. Raise your hand for assistance • A- Complete Study Guide Questions • M – You may choose a seat • P- Complete Front side. Compare your answers with your partner or group. • If you are finished work on Chapter 2 Vocabulary Review
Math Journal Question • What did I do today in math? • What did I learn today in math?
Math Notebook: • Classwork/ Current Work Warm Ups • Graded Work • Graded test • Completed HW • Reference & Notes • Vocabulary Foldables
References • Honeycutt, N. (2007) Human Whisker Box Plot Retrieved November 19, 2011 from http://www.learnnc.org/lp/pages/3767?style=print.