Quantify Activity 3: Large chemistry modeling
180 likes | 280 Vues
This project focuses on evaluating the performance of multi-model chemistry simulations against observational data, analyzing the current impact of transport emissions on chemical composition, and exploring future impacts and mitigation strategies. Utilizing large-scale chemistry models and advanced analysis tools, the study evaluates the influence of different transport modes on atmospheric composition, including emissions from aircraft, ships, and road traffic. The research also investigates the effects of various emissions reduction scenarios and precipitation impacts on nitrogen and sulfur compounds. Through comprehensive modeling and assessment, this project aims to provide valuable insights into the interactions between transport emissions and atmospheric chemistry.

Quantify Activity 3: Large chemistry modeling
E N D
Presentation Transcript
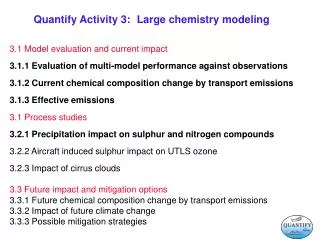
Quantify Activity 3: Large chemistry modeling 3.1 Model evaluation and current impact 3.1.1 Evaluation of multi-model performance against observations 3.1.2 Current chemical composition change by transport emissions 3.1.3 Effective emissions 3.1 Process studies 3.2.1 Precipitation impact on sulphur and nitrogen compounds 3.2.2 Aircraft induced sulphur impact on UTLS ozone 3.2.3 Impact of cirrus clouds 3.3 Future impact and mitigation options 3.3.1 Future chemical composition change by transport emissions 3.3.2 Impact of future climate change 3.3.3 Possible mitigation strategies
WP3.1.1 Evaluation of multi-model performance against observations Status • Focus on year 2003 and on [convective transport, STE, and BL venting] • Campaign data in ETH-MEG database: • SPURT, MOZAIC, CONTRACE II, WDCGG surface observations, ozonesondes • Satellite data:SCIAMACHY NO2 columns (planned) • Advanced analysis tools: point-to-point comparisons, pdf‘s, & Taylor diagrams, … • Time-pos data on-line available • Observations and model output available after signing data protocol
WP3.1.2 Current impact of transport modes Applied large scale chemistry models: TM4 (off-line ECMWF meteo) Oslo CTM2 (off-line ECMWF meteo) p-TOMCAT (off-line ECMWF meteo) LMDZ-INCA (relaxed to ECMWF meteo) E5/MESSY (relaxed to ECMWF meteo) E39/C (10 year simulation 1990s)
Set-up for current impact simulations Emissions for 2000 (on ftp-server Mainz): EDGAR-FT 2000, incl, road traffic Ship emissions from Endresen AERO2K aviation emissions Biogenic emissions from MPI Match Surface CH4 prescribed Lightning 5 Tg(N) /yr Simulations: all emissions (base) -5% aircraft emissions -5% ship emissions -5% road traffic emissions -5% transport (aircraft+ships+road traffic) Model output on Oslo fileserver: http://srb.uio.no/mySRB
Background Transport NOx July (monthly mean zonal mean 2003) TM4 Ships Road Aircraft
Background Aircraft Ships Road Transport TM4 NOx July (monthly mean zonal mean 2003) Oslo CTM2 p-TOMCAT LMDz-INCA E39c (1990s)
Ozone perturbation by transport modes (LMDZ-INCA) Lightning : 2.24 TgN/yr Aircraft Road traffic Ships April April April Max: 2.3 ppbv Max: 2.08 ppbv Max: 1.97 ppbv July July July Max: 2.96 ppbv Max: 2.76 ppbv Max: 2.24 ppbv 6,85 TgN/yr 8.02 TgO3/yr 4,39 TgN/yr 7,14 TgO3/yr 0,67 TgN/yr 3,58 TgO3/yr 1st EU-India Strategic S&T Workshop "Climate change research needs", New Delhi, 8-9 Feb 2007
Background Aircraft Ships Road Transport TM4 Ozone July (monthly mean zonal mean 2003) Oslo CTM2 p-TOMCAT LMDz-INCA E39c (1990s)
Methane lifetime changes (%) Linearity/additiveness Ships have relatively large impact
Change (%) in the aircraft effect on O3 due to plume effects in OsloCTM2 (T42) (plume-noplume)/(noplume-noaircraft)*100% WP3.1.3 Effective emissions – preliminary results
WP3.1.3 Effective emissionsApproach proposed by CERFACS ∂ NOx/ ∂ t = + (1/ ).EI .f+ <V. NOx> + large scale chemistry terms .. NOxlarge scale (CTM/GCM) mixing ratio f fuel tracer mixing ratio EI Emission Index due to small scale chemical conversions only time scale for the diffusion, provided by Act. 2
Aircraft Ships Road traffic WP3.2.1 Precipitation impactNOy deposition in TM4 Dry Wet
Conclusions Results from models different but consistent Linearity/additiveness of perturbations Aviation NOx relatively efficient in producing ozone Shipping causes relatively largest methane perturbation Preliminary estimate of plume conversions: reduction by about 20 % of the ozone perturbation by aviation Road traffic and ship emissions have relatively important contribution to nitrogen deposition, concentrated in specific regions such as western Europe, east coast US
Spare slides follow
Discussion needed by A3 A2 – effective emissions A1 – future scenarios, mitigation options A5 – use of model output
Background Transport TM4 Ozone July (monthly mean zonal mean 2003) Road Ships Aircraft
Aircraft Ships Road traffic All NOy-deposition TM4 Dry pTOMCAT TM4 Wet pTOMCAT