Measuring EdMap Program Success: A Quantitative Analysis
Explore the numerical representation of EdMap program achievements in its 17th year. Learn about key success indicators such as funding, student employment, societal and science issues addressed, peer-reviewed publications, and more. Discover the impact of EdMap through relationships, mentorships, and collaborations with various stakeholders.

Measuring EdMap Program Success: A Quantitative Analysis
E N D
Presentation Transcript
EdMap Training Program Successes 104th AASG Annual Meeting Austin, TX June 11, 2012
How do we measure EdMap success? • Numerically? • Multivariate statistical analysis approach? • Dependence, Correlation, Principal Component Analysis (PCA) by eigenvalue decomposition • Observations of possibly correlated values • Funding by year and over the lifetime of the program • Number of students funded • Number of institutions funded • Societal issues addressed (number/type) • Science issues addressed • Number of EdMap students employed in the geosciences • Number of EdMap students employed elsewhere • Number of EdMap students contributing to mapping post-graduation • Number of peer-reviewed publications • Number of proposal submitted • Number of proposals funded • Number of people employed • Number of maps produced (by scale) • Area of US mapped over time • Number of real outcomes (by type/issue) • Number or percentage of student geologic maps available to the public • Number of geologic maps served to the community • Award win rate for EdMap over the program • Number of digital vs. paper maps used • Mapping technologies used and developed • Number of pre-EdMap (K-12) students or programs involved in geologic mapping
Numerical representation of the EdMap program successes • EdMap in its 17th year • FY2012 funded its 1000th student mapper • $7.9 M in program investments to date • 100’s of GSA abstract submissions and presentations • 10’s of peer-reviewed journal publications
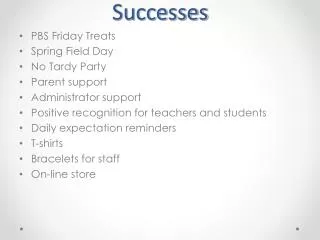
How else can we measure EdMap success? • Relationships • 1000’s of relationships • Mentorships • Professor and student • Professional and student • Collaborations • USGS, University, State Geological Surveys, GEOFORCE, other government agencies, and industry • Peer to peer • The return on investment is immense.