Gene Expression Analysis of Yeast: A Bioinformatics Project
450 likes | 554 Vues
Study gene expression in yeast using bioinformatics tools. Extract data from FASTA and GTF files, analyze FPKM, intron length, and more. Visualize highly expressed genes in interaction networks. Learn about Codon Usage Bias and analyze top 100 genes. Utilize Cufflinks, Cuffmerge, and Cytoscape for data visualization.

Gene Expression Analysis of Yeast: A Bioinformatics Project
E N D
Presentation Transcript
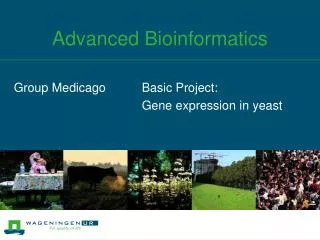
Advanced Bioinformatics Medicago Basic project: Study gene expression under a single condition
Team members • Jente • Lifei • Yuebang • Nick
Input data • Fastq files as sequence data • Genome.fa file as a reference genome • Genes.gtf
Tophat, Cufflinks and Cuffmerge • Genes.gtf, genome.* and the fastq files are used to generate .bam files • The accepted_hits.bam is used by Cufflinks to generate a file called transcripts.gtf • Because the experiment was in triplo, we get 3 transcripts.gtf files. These are merged together with Cuffmerge.
gtf_to_fasta • With the program gtf_to_fasta we create a fasta file which contains all the transcripts with sequences. • So now we have a fasta and a gtf file to extract data from with the help of programs and scripts.
The Big Hash Table • From the FASTA we use/determine: • Gene_id • Sequence length • GC content • Codon usage • From the GTF we use/determine: • Gene_id • Expression level • Inter-transcript size • Intron length
Reading gtf file: • Sort top 100 expressed genes • From the GTF we use/determine: • Gene_id • Expression level • Inter-transcript size • Intron length
Key point: • First order, then get top 100 genes. • Build hash table: gene_id(keys) to FPKM, intron length, inter-transcript(values).
Using array:Gene_ID and FPKM in seq[8] • Inter-transcript: use defined($seq2[1]) • Intron length: divid into different conditons (subroutines) After reading next transcript line, calculate last intron length .
Why we need to analyse FPKM, intron length,inter-transcript(correlation)?
FPKM: gene expression level • Intron length: positive to gene expression level • Inter-transcript: gene density
Reading the fasta file • The important information is the sequence. • From this GC content, codon usage etc. can be determined. • To couple this info to the gtf output, we analyse the ID as well.
Reading the fasta file • The analysis was performed by reading the file line by line, just like the exercises. • Then the ID was extracted from the first line and saved in a heshtable. • Normally heshtables have only a key and one value but we managed to put arrays in these values.
Reading the fasta file >xxxxx 1:783285 gene_idetcetcetcetcetcetc. AGCTGCTAGGCTGCGCATCGTGAGCTGCCTTG %hesh ID; seqLength, GC_content, codonUsage
Combine the best of both! • The array values from the %gtfhesh table are pushed into the %fastahesh table. • For example: my $newval = $gtf {$i} [0]; my $newval2 = $gtf {$i} [1]; push @{ $fasta{$ID} }, "$newval\t", "$newval2\t”;
# Heshtable # • In this way we obtained a table that contained: • ID; length, CUP, GC, TSp, TEp, ITL, Intron size(s) • We give options to show a variable number of genes and to sort on specific parameters. • Now Jente will unleash his package…
Package: Jente My Package • Codon Usage Bias • R: correlations Jente
Codon Usage Bias • Relative Synonymous Codon Usage (RSCU) • Effective Numbers of Codons (NC)
Codon Usage Bias • RSCU • Not in pipeline • Optional subroutine
Codon Usage Bias NC = 2 + + + Only possible for sequences that use all amino acids Codon Usage Proportion (CUP) CUP =
R: Correlations R = -0.1205 FPKM GC
R: Correlations R = -0.1220 Highly expressed genes have a more extreme codon bias tRNAs?
R: Correlations R = -0,1282 Highly expressed genes are smaller More efficient?
R: Correlations R = 0,9588 Longer genes use more codons...
Visualize highly expressed genes in the interaction network • What are Networks? • A map of interactions or relationships • A collection of nodes and links (edges) • Why Network? • predict protein function through identification of partners • Protein’s relative position in a network • Mechanistic understanding of the gene-function & phenotype association
Interaction network (1) Download Yeast Interactome: http://interactome.dfci.harvard.edu/S_cerevisiae/index.php?page=download http://www.yeastnet.org/data/
Interaction network (2) RuningCytoscape and import yeast Interactome
Interaction network (3) Visualize analysis of the interaction network
Interaction network (4) Visualize the highly expressed genes in interaction network
Interaction network (6) Top 100 genes interactome data
Interaction network (10) Visualize the highly expressed genes in interaction network
Interaction network (11) Interaction network of top 100 intractome data
GO graph (1) IntallBiNGO
GO graph (2) Import the top 100 expression genes, and start BiNGO
Conclusion In the CCSB-Y|1 file, 8 genes of top 100 highly expressed genes are found, and no directly interaction among them in the interaction network It is confirmed highly expressed genes are related to production of protein by GO term.