Quantifying Health Risks
Quantifying Health Risks. L.G.H. Koren & J.E.M.H. van Bronswijk Eindhoven University of Technology. Background information for Assignment 3. Health risk analysis. Individual Health Individual Exposure Assessment Medical Diagnosis Public Health Exposure Assessment

Quantifying Health Risks
E N D
Presentation Transcript
Quantifying Health Risks L.G.H. Koren & J.E.M.H. van Bronswijk Eindhoven University of Technology Background information for Assignment 3 LGH Koren, TU Eindhoven
Health risk analysis • Individual Health • Individual Exposure Assessment • Medical Diagnosis • Public Health • Exposure Assessment • Incidence of Nuisance, Stress or Disease • Prevalence of Nuisance, Stress or Disease • Chain Model Risk Analysis • DALY’s (Disability Adjusted Life Years) LGH Koren, TU Eindhoven
Individual-Health Risk Analysis • Individual Exposure Assessment • Personal samplers (physical and chemical agents) • Medical Diagnosis • A disease may be caused by a number of agents • One agent may cause a number of diseases • Preventive medicine: when belonging to a risk group • Design of Built Environments • Safety implications LGH Koren, TU Eindhoven
Exposure Assessment • (Continuous) measurements of markers or noxious agents • Relation with health is proven elsewhere • Incidence of Nuisance, Stress or Disease • Number of new cases diagnosed in 1 year • Relevant for safety of built environments • Prevalence of Nuisance, Stress or Disease • Number of cases known in 1 year or life span • Relevant for sustainable comfort of built environments • Chain Model Risk Analysis • Process analysis (OHS approach) • For stepwise improvement • DALY’s (Disability Adjusted Life Years) • Healthy years in a life span calculation • For comparison of health results of different designs Public Health Risk Analysis LGH Koren, TU Eindhoven
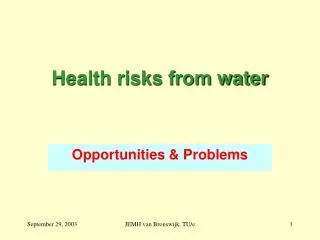
Chain Model Risk Analysis • Method of Choice in OHS (Occupational Health and Safety) • Estimates probability, severity and damage of incidents • Used for risks of water, air, fire, burglary, socio-economic living conditions, leisure and occupational activities LGH Koren, TU Eindhoven
Chain model risk analysis Risk of health damage from pathogenic organisms in water Risk of health damage from flaws in construction • Identify sources • Estimate emission • Estimate exposure • Estimate risk of disease • Evaluate acceptability • Identify risk areas • Estimate calamity limits • Estimate calamity effects • Estimate calamity chances • Evaluate acceptability Example: Versteegh et al. 1997: http://www.rivm.nl/bibliotheek/rapporten/289202019.html LGH Koren, TU Eindhoven
2nd Quality Water in Dwellings • An experimental, environmental measure • Risk Sources: shower, washing machine, WC, bath, outdoor tap; frequency of use, liters used • Emission: pathogens Campylobacter, Salmonella, E. coli, different viral agents; range of organisms per liter, dose-response curve • Exposure: swallowing, inhaling; estimated amounts in ml • Risk of disease: worst-case approach: use of every range the most disadvantageous end LGH Koren, TU Eindhoven
2nd Quality Water UseA Risk Example Use of 2nd quality water has recently been discouraged by the national Netherlands government LGH Koren, TU Eindhoven
DALY: Disability-Adjusted Life Years • Long term health effects • Premature death (= lost years) + • Lost vitality (=burden of existing disease) LGH Koren, TU Eindhoven
Total burden of disease = Number of lost years (weight = 1 for each lost year) + Years with disability (weight = 0.01-0.99 / year depending on disease burden) Source: http://www.rivm.nl/nationaalkompas/data/gezondheidstoestand/svm/daly/daly_ziektelast.htm LGH Koren, TU Eindhoven
DALY calculations Weighing factors based upon the burden of the disease Weighing factors differ for the different stages or severities of the disease All based upon (incomplete) medical registration of cases Currently 52 diseases are weighed (because of their relative importance), the list will grow LGH Koren, TU Eindhoven
Disease Burden of disease in: Burden of disease in DALY's (=A+BxC) Lost years A Prevalence / incidence B Gravity (weighing factor) C Asthma 1.742 444.900 0,08 37.334 Atopic dermatitis <1 160.900 0,07 11.263 COPD (bronchitis + lung emphysema) 58.175 289.500 0,31 147.920 Coronary diseases I 186.746 556.600 0,29 348.160 Extrinsic allergic alveolitis <1 200 0,3 60 Mycoses <1 200 0,2 40 Lung cancer I 119.607 19.900 0,44 128.363 Lung infections (pleuritis) 49.448 638.600 0,04 74.992 Totaal 418.151 2.516.330 758.847 Building-related diseases and DALY’s in the Netherlands LGH Koren, TU Eindhoven
Examples for a DALY Calculation Take a Person with a life expectancy of 75 years: - S/he dies at age 58 from a fall - S/he dies at 75 with rheuma (weighing factor 0.5) since age 41 - S/he dies at age 65 with mild diabetes (weighing factor 0.2) since age 30 LGH Koren, TU Eindhoven
DALY calculation sheet Disease Burden of disease in: Burden of disease in DALY's (=A+BxC) Percentage building-related Building-related burden of disease in DALY's Lost years A Prevalence / incidence B Gravity (weighing factor) C Asthma 1.742 444.900 0,08 37.334 70% 26.134 Atopic dermatitis <1 160.900 0,07 11.263 20% 2.253 COPD (bronchitis + lung emphysema) 58.175 289.500 0,31 147.920 10% 14.792 Coronary diseases I 186.746 556.600 0,29 348.160 5% 17.408 Extrinsic allergic alveolitis <1 200 0,3 60 10% 6 Mycoses <1 200 0,2 40 10% 4 Lung cancer I 119.607 19.900 0,44 128.363 4% 5.135 Lung infections (pleuritis) 49.448 638.600 0,04 74.992 5% 3.750 Totaal 418.151 2.516.330 758.847 70.094 LGH Koren, TU Eindhoven
Estimated Health Effects (in DALY’s) of Ventilation Systems LGH Koren, TU Eindhoven
Health effects (in DALYs) of different energy-reducing building and installation measures LGH Koren, TU Eindhoven