Download
1 / 22
230 likes | 319 Vues
Explore the origins and impact of the 2008 financial crisis, from the Community Reinvestment Act to the collapse of major financial institutions and the ensuing economic turmoil.

E N D
Shareholders Services Association October 23, 2008 Economic and Financial Overview Presented by Bernard Schoenfeld
Housing Starts • Seasonally Adjusted Annual Rate
An Un-PC View of the Financial Crisis:How Did We Get Here? • 1977 – Community Reinvestment Act • Prohibits “redlining” • 1992 – Federal Housing Enterprises Financial Safety and Soundness Act • Required Fannie Mae and Freddie Mac to devote a percentage of their lending to affordable housing • 1994 – In response to a request from President Clinton, HUD Secretary Henry Cisneros met with leaders of housing industry to develop a National Homeownership Strategy • Sought to achieve an “all-time high level of homeownership” • Sought innovative approaches to mortgage financing to make homeownership more affordable • Advocated financing strategies to help homebuyers that lack cash to buy a home or income to make the payments • 1995 – Administrative changes instituted to encourage more CRA loans • Role of CRA lending in subprime crisis remains controversial
The Financial Crisis: How Did We Get Here? • 2004 - SEC instituted change in Net Capital Rule • Created in 1975, rule required that broker dealers limit their debt-to-net capital ratio to 12-to-1. • Rule applied a “haircut” (discount) in valuing assets to allow for market risk. • In 2004, SEC changed the rule in response to changes in rules passed by European Union. • Consolidated Supervised Entities program • Enabled SEC to oversee both the broker dealers and their holding companies • Voluntary program for broker dealers with capital of at least $5 billion • Five firms qualified: Bear Stearns, Lehman Brothers, Merrill Lynch, Morgan Stanley, and Goldman Sachs • Allowed greater leverage and allowed use of mathematical models that effectively reduced “haircut” • One result was a huge increase in leverage. • Merrill Lynch’s debt-to-net capital ratio reached 40-to-1. • On 9/26/2008, SEC Chairman Cox • Stated “…voluntary regulation does not work.” • Announced end of Consolidated Supervised Entities program
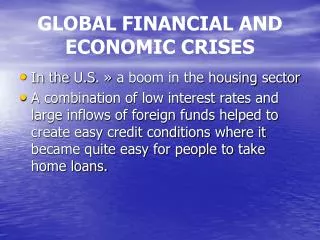
The Financial Crisis: How Did We Get Here? • Reluctance to regulate • In a low interest rate environment, investors reached for yield and embraced “creative” solutions to raise returns. • Securitization – mortgage loan originators did not have to live with the consequences of their approvals. • Ratings agencies rated securities based on subprime mortgages as AAA. • Housing bubble burst; home prices declined. • In many cases with subprime mortgages, value of home became less than amount owed on mortgage. • Prices of securities based on subprime mortgages plummeted. • Capital base of financial institutions that invested in these securities was eroded, exacerbated by leverage. • Crisis of confidence; reluctance to lend
Crude Oil • West Texas Intermediate Spot Price
Real GDP • Quarter-to-Quarter Percent Change at an Annual Rate
Consumer Price Index • Percent Change Year Over Year
Commodity Research Bureau (CRB) / Reuters Futures Price Index
Interest Rates 10-Year Treasury Note Federal Funds
Euro & Yen Euro Yen
Major Investment Benchmarks • Annualized Total Returns for Periods Ending September 2008
Major Investment Benchmarks • Annualized Total Returns for Periods Ending September 2008