Download
1 / 24
240 likes | 430 Vues
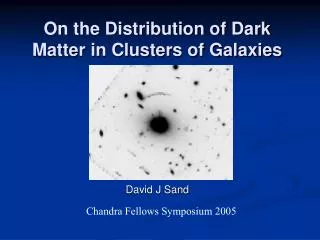
On the Distribution of Dark Matter in Clusters of Galaxies. David J Sand. Chandra Fellows Symposium 2005. Cold Dark Matter Simulations. log ( ). log (radius). Moore simulation. Inner profile: r - NFW: 1.0 Moore: 1.5.

E N D
On the Distribution of Dark Matter in Clusters of Galaxies David J Sand Chandra Fellows Symposium 2005
Cold Dark Matter Simulations log () log (radius) Moore simulation Inner profile: r - NFW:1.0 Moore: 1.5 CDM is: non-relativistic (cold); collisionless; well motivated theoretically and observationally
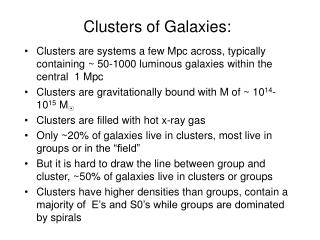
Galaxy cluster scale Strength: Total mass constraints without assumptions about dynamical state of cluster. Weakness: Need more info to separate dark and luminous components. Kneib et al. 2003; found outer slope out > 2.4 Smith et al. (2001); tot ~ 1.3 Strong and Weak Gravitational Lensing
Extended velocity dispersion profile of the brightest cluster galaxy(e.g. Kelson et al. 2002) Velocity Dispersion profile of the galaxies in the cluster(e.g. Carlberg et al. 1997; Katgert et al. 2003) Galaxy cluster dynamics Strength: Can probe to high cluster radii. Weakness: Must assume orbital properties of stars/galaxies. NFW profiles require unrealistic stellar M/L (Kelson et al. 2002)
Wide range of inner slope values have been found: ≈ 0.6 (Ettori et al. 2002) to ≈1.2 (Lewis et al. 2003; Buote & Lewis 2003) to ≈1.9 (Arabadjis et al. 2002). X-ray Observations of the ICM Strength: Can probe to high cluster radii Weakness: Must assume the cluster is in hydrostatic equilibrium; difficult to account for central BCG! From Lewis et al. 2002; note the BCG component can dominate on ~10kpc scales
Lensing + BCG Dynamics GOAL: Combine constraints from dynamics of BCG/cD galaxies with lensing to measure the mass density profile of the inner regions of clusters.
MS2137-23 zclus=0.313 zarc=1.50 ESI spectrum Two component, spherically symmetric mass model representing BCG and cluster DM halo. We utilize 3 free parameters: M*/L, , c. . Scale radius fixed at 400 kpc.
MS2137-23 Results Best-fitting density profile: r - with = 0.57 0.11
Issues to Explore • One object cannot be used to understand the DM density profile of clusters! • What effects could ellipticity and substructure have on our results (see e.g. Dalal & Keeton 2003; Meneghetti et al. 2005)? • Should scale radius be a free parameter?
More radial arc systems <> = 0.52 ~ 0.3
Tangential Arc Systems Upper limit: < 0.57 (99% CL) CONCLUSION: Radial arc systems are not biased toward shallower profiles.
Full 2D modeling of MS2137 • We have upgraded J.P. Kneib’s LENSTOOL software to include generalized NFW mass profiles. • LENSTOOL accounts for ellipticity (both in luminous and dark matter components) and substructure (e.g. associated with visible galaxies). • Can take into account the full multiple imaging constraints • Two background sources associated with the tangential and radial arcs • Multiple images determined from spectroscopy, surface brightness conservation and iterative lens modeling. • Two features on the tangential arc and one on the radial arc are identified.
Constraints on inner slope with CDM motivated prior on rsc The inner slope is =0.25+0.35-0.12 - in agreement with work of Sand et al. 2004 (=0.57+0.11-0.08) . However, the best-fitting rsc is poorly constrained.
Summary & Conclusions What constraints do we get on the inner slope? Ellipticity of MS2137 Our inner slope constraints are robust if the DM halos are nearly round, as in MS2137. At least some cluster DM halos appear to have shallow inner slopes. obs/sim Meneghetti et al. 2005 Other issues remain: How do we constrain the scale radius? What effect does triaxiality have on our results? Would dark matter models that have undergone adiabatic contraction better fit the data?
Combine & Compare Lensing, X-ray and Dynamics Will partially remove inherent degeneracies and account for all major cluster mass components + + Kelson et al. 2002 X-ray surface brightness and temperature K-band data and/or galaxy velocity dispersion profile Weak + Strong lensing data
Lensing critical lines • Critical lines are those places in the image plane where the magnification formally diverges. • Radial arcs are presumably often obscured by bright, central galaxies in clusters. Critical curves occur at the roots of the eigenvalues of the Jacobian that describes the lensing transformation. Narayan & Bartelmann 1997
Stellar spectra are used as templates. They are smoothed and redshifted to match the BCG. The Gauss-Hermite pixel-fitting software (van der Marel 1994) was used. In practice, it convolves a template with a line-of-sight velocity profile and compares it with the BCG spectrum. Ellipticals are pressure supported (no/slow rotation). Expect 2 r2 from integrating spherical Jeans eqn. Measuring and Modeling Velocity dispersion profiles Modeling Measuring Kelson et al. 2002
Constraints on the inner slope with rsc=400 kpc fixed Direct Comparison with Sand et al. 2004 Lensing Only Lensing + Dynamics Lower values of cannot fit the angular structure of the lens model. Same M/L range as Sand et al.
Despite systematic check with LENSTOOL; concern remains about 1D modeling performed in Sand et al. (2004;2002) Suggest that by including ellipticity NFW profiles are not ruled out! Fixed scale radius of 400 kpc may also bias results. More complex Modelling?Dalal & Keeton (2003); Bartelmann & Meneghetti (2004); Meneghetti et al. 2005 Dalal & Keeton 2003 Estimated range of systematic <> from Sand et al. 2003
Multiple Image Interpretation • Two background sources associated with the tangential and radial arcs • Multiple images determined from spectroscopy, surface brightness conservation and iterative lens modeling. • Two features on the tangential arc and one on the radial arc are identified. Perturber
Comparison with 2D results Using LENSTOOL allows the effects of substructure and ellipticity to be taken into account. CONCLUSION: Neglect of substructure and ellipticity leads to at most a ~ 0.2 systematic.
Best-fitting density profile Histogram of ellipticity in the potential The best mass models are centered around ~0.1 which translates to an ellipticity in the surface density of ~0.2 =0.20; 2=21.2 for 16 degrees of freedom