Download
1 / 28
280 likes | 445 Vues
Clusters of galaxies. With a wide-field multi-IFU spectrograph. Cluster studies. Clusters provide large samples of galaxies in a moderate field Unique perspective on the interaction of galaxies with their environment

E N D
Clusters of galaxies With a wide-field multi-IFU spectrograph
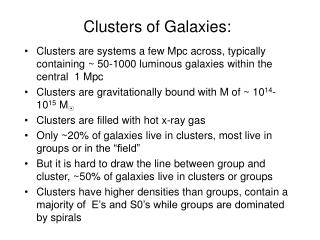
Cluster studies • Clusters provide large samples of galaxies in a moderate field • Unique perspective on the interaction of galaxies with their environment • As they operate much as a closed box, they are useful as tracers of galaxy evolution and of cosmology
Premise • We will propose a multi-IFU instrument useful for the study of galaxies in clusters
Key design requirement parameters • Field of View • Spectral resolution • Wavelength coverage • Efficiency or throughput • Crowding restrictions (fibre bundle collisions) • Number of IFUs • Number of elements per IFU • Reconfiguration time
Competitors/references • Keck/DEIMOS; Keck/LRIS (multislits) • VLT/KMOS (infra-red) • MMT/Hectospec (single fibre) • AAT/AAOmega (single fibre) • VLT/Giraffe • 15 IFU + 15 sky • Each IFU is only 20 elements, 3x2 arcsec, 0.5 arcsec pixels.
Cluster sizes • Redshiftz = 0.003 (Virgo) to 1.4, WHT will operate at the low end of this. • Core radius ~1.5o for Virgo, ~7 arcmin for Coma, to a few arcseconds. • Virial radius (normally taken as the radius at which the density is 200 x ambient) is ~2 Mpc for rich clusters (1.2o at Coma) • 1.5 degree diameter field would match virial radius at z~0.035.
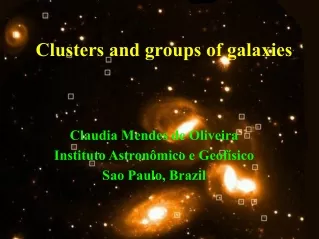
Cluster types • Classified by: • Richness • Concentration • Dominance of central galaxy (Bautz-Morgan) • Morphology (Rood-Sastry) – cD, B, L, C, I, F • Galaxy Content (elliptical rich, spiral rich etc) • X-ray structure • Clusters present a wide range of environments
A1656 – BM II A1367 – BM II-III A2199 – BM I A2151 – BM III
What do we want to know • Mass profiles • Galaxy properties • Luminosity function • Stellar content • Evolution with redshift of these properties • Effect of environment upon galaxy: • Morphology • Current star formation • Dynamical state (e.g. tidal truncation)
Cluster evolution • Necessity of low redshift samples in clusters of all types. • Easy to get 8-10 m time for high-redshift clusters, but not for the vitallow-redshift comparisons. • WHT is best employed making sure we understand the low-redshift population.
Science measurements • Absorption lines • Spatially resolved kinematics • Velocity (for membership),Velocity dispersions, Fundamental Plane • Line strengths • Ages, metallicity, epoch of last star formation, ”Z-planes” • Emission lines • Spatially resolved kinematics • Tully-Fisher relation • Ram pressure or tidally induced star formation • Fluxes or equivalent widths • Metallicity in galaxies and intra-cluster gas
Examples: • Examples from recent work • How can WHT contribute when there are larger telescopes around? • What are the requirements?
Example – Fundamental plane and Faber-Jackson relation of dwarfs EhsanKourkchi et al. – Keck/DEIMOS data
Example – Fundamental plane and Faber-Jackson relation of dwarfs EhsanKourkchi et al. – Keck/DEIMOS data
Requirements for FP/FJ relation • σ down to 20 km/s requires R ~ 5000 - 7000 • λrange 820 – 870 nm and/or 480 – 570 nm • Control over aperture corrections • IFU aperture ~ 10 arcsec for comparison with Keck etc. observations of clusters at Z ~ 0.5 - 0.8 • Samples of tens of galaxies (not hundreds) • Exposures of hours
Stellar populations • Estimate 3 parameters: weighted age; [Z/H]; [α/Fe] (or [E/Fe]) by fitting line pairs of index measurements onto model grids. • [α/Fe] tells you something about the timescale of star formation. Keck/LRIS data Scaled Solar [E/Fe] = +0.3
Example – Star formation ceased more recently in the outer parts of Coma Russell Smith et al. using MMT/ Hectospec
Requirements for stellar populations • R ~ 1000 • λ range 390 – 600 nm (820 – 870 nm also useful but not vital) • Field of view ~ 1 degree or more. • Aperture ~ 10 arcsec if we are comparing with distant clusters • Samples of tens to hundreds of galaxies.
Hα images Example – tidal or ram-pressure induced starbursts • Sakai et al. in Abell 1367 • Anomalously metal rich starbursts?
Requirements for emission line diagnostics • R ~ 1000 – 2000 • λrange 370 – 700 nm • Field size ~ virial radius • Aperture 10 - 30 arcsec • Samples of a few
Distant clusters (z ~ 0.3 – 0.5) • Postman et al. HST/MCT allocation • 524 orbits with ACS and WFC3 • 24 clusters z ~ 0.15 – 0.9, in 14 passbands • Headline science is gravitational lensing and supernovae, however far more interesting will be the multiband dataset on the cluster targets themselves. • Spectroscopic followup of samples selected on colours and morphology.
Distant clusters (z ~ 0.3 – 0.5) • EDisCS • ESO Distant Cluster Survey • Identification, deep photometry and spectroscopy of 10 clusters around z ~ 0.5 and 10 around z ~ 0.8 • Spectroscopy is FORS2 (R ~ 1200) • Science goals are build up of stellar populations with redshift (plus weak lensing).
However: • In general spectroscopic followup will use larger (8-10m) telescopes. • Better with single fibres, with more attention paid to how close you could position them to each other. • Alternative is large single IFU covering whole cluster core • Moves required spectral coverage for same science goals redwards.
Example – Evolution of the Tully-Fisher relation • Originally a distance indicator, now a tool for measuring evolution of galaxy luminosity • Correlation between Vmax and absolute magnitude • Originally Vmaxfrom HI single beam measurements • Optical Vmax measured with Hαline • Aperture has to be large enough
Optical Tully-Fisher relation From StéphaneCourteau Require to get out to 10 – 20 kpc Top horizontal axis is in kpc
Tully-Fisher relation at z ~ 0.3 – 0.5 • Metevier et al. in Cl0024 at z ~ 0.4. Keck/LRIS data • Find galaxies underluminous with respect to local T-F relation
Requirements for T-F evolution • Aperture must be 20 – 40 kpc diameter, equal to 4.8 – 9.6 arcsec at z = 0.2. • R ~ 1000 • λrange 780 – 990 nm (Hα at z = 0.2 - 0.5) • Field size 5 - 15 arcminutes • Samples of 10 - 30
Key design requirement parameters • Field of View 1.5o; 1o minimum • Spectral resolution R = 1000 - 7000 • Wavelength coverage λ= 370 – 990 nm • Crowding restrictions (fibre bundle collisions) 2-3 x aperture size • Number of IFUsMinimum 30 • Number of elements per IFU 100 (10 x 10 arcsec) • Reconfiguration time not critical