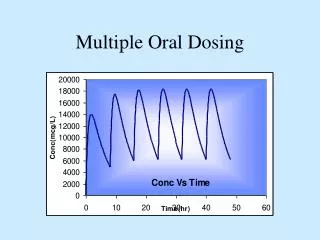
Dosing Regimen Design
Dosing Regimen Design. Nonlinear Kinetics. Saturable metabolism. When elimination is “linear”, CL is independent of the amount of drug in the body and the steady-state plasma concentration is directly proportional to the dosing rate: C ss = K o /CL C ss,av = F •Dose/CL .


Dosing Regimen Design
E N D
Presentation Transcript
Dosing Regimen Design Nonlinear Kinetics
Saturable metabolism When elimination is “linear”, CL is independent of the amount of drug in the body and the steady-state plasma concentration is directly proportional to the dosing rate: Css = Ko/CL Css,av = F•Dose/CL
Michaelis-Menten Kinetics and Dosing Rate Vmax = 500 mg/h KM = 4 mg/L Rate In = Rate Out
FDM/ Ko Cp,ss CL Non-linear relationship As dose rate increases, there is a more-than-proportional increase in Cp,ss. “Amplifier” or “positive feedback loop”
Example: phenytoinTherapeutic Window: 10-20 mg/L Patient values of KM and Vmax: 3 mg/L & 425 mg/day. Patient is taking 200 mg po b.i.d. F = 0.85; DR = (0.85)(400 mg) = 340 mg/day Css = KMDR/(Vmax - DR) = (3mg/L)(340 mg/day)/(425 – 340 mg/day) = 12 mg/L If F increased to 0.95 because of product change, DR would be 380 mg/day and Css would be: Css = (3)(380)/(425 – 380) = 25.3 mg/L
Time to steady state As metabolism becomes saturated by escalating body level, CL is reduced and half life is increased. Time to steady state is thereby increased: = t90% Rowland and Tozer, Fig. 22.15, p. 410.
FDM/ Ko Cp,ss CL Change in CL also gets amplified Principal examples of single saturable metabolism pathway: phenytoin and ethanol. Another possibility is that the drug is eliminated by several pathways, only some of which are saturable. Examples include salicylate, propranolol, and theophylline.
CLlin = 1L/h Db CLsat Parallel linear and saturable pathways KM = 2.22 mg/L Vmax = 100 mg/h CL = CLlin + CLsat When Css << KM, CL = 100/2.22 + 1 = 46 L/h When Css >> KM, CL 1 L/h
ke Ko Vmax, KM Two Plateaus With parallel linear and saturable pathways, the Css vs. Ko relationship has two plateaus, below and above the KM of the saturable pathway. With the parallel pathways system, saturation of one pathway is clinically important only when the saturable pathway accounts for more than 50% of CL in the linear region.
ke Ko Vmax, KM linear nonlinear linear
KE t Autoinduction: carbamazepine Pitlick, Levy, et al., J. Pharm. Sci. 65:462,1976. t1/2,I = 3.5 days KE,/KE,0 = 2 Rowland and Tozer, Fig. 23-6, p. 430.