Download
1 / 96
970 likes | 1.09k Vues
The Linked Environments for Atmospheric Discovery (LEAD) initiative aims to revolutionize mesoscale weather analysis by overcoming the limitations of traditional IT frameworks. By enabling dynamic and adaptive interactions among scientists, students, and operational practitioners, LEAD addresses the challenges posed by complex datasets and high computational demands. With a focus on real-time, geospatially referenced data from various sources, LEAD promotes innovative weather forecasting and decision support systems. This multidisciplinary approach enhances our understanding and responsiveness to critical mesoscale weather phenomena.

E N D
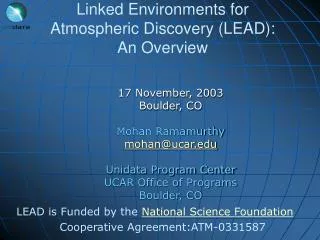
Linked Environments for Atmospheric Discovery (LEAD) Kelvin K. Droegemeier School of Meteorology and Center for Analysis and Prediction of Storms University of Oklahoma Jay Alameda National Center for Supercomputing Applications University of Illinois at Urbana-Champaign
Geosciences CI Challenges • Enormously complex human-natural system • Vast temporal (sec to B yrs) and spatial (microns to 1000s of km) scales • Highly nonlinear behavior • Massive data sets • physical and digital • static/legacy and dynamic/streaming • geospatially referenced • multidisciplinary and heterogeneous • open access
Geosciences CI Challenges • Massive computation • weather, space weather, climate, hydrologic modeling • seismic inversion • coupled physical system models • Inherently field-based, visual disciplines with the need to manage information for long periods of time • Bringing advanced CI capabilities to education at all levels • Connecting the last mile to operational practitioners
Where ALL These Elements Converge: Mesoscale Weather • Each year, mesoscale weather – floods, tornadoes, hail, strong winds, lightning, and winter storms – causes hundreds of deaths, routinely disrupts transportation and commerce, and results in annual economic losses > $13B.
What Weather Technology Does… Forecast Models NEXRAD Radar Decision Support Systems
What Weather Technology Does… Forecast Models NEXRAD Radar Absolutely Nothing! Decision Support Systems
The LEAD Goal Provide the IT necessary to allow People (scientists, students, operational practitioners) and Technologies (models, sensors, data mining) TO INTERACT WITH WEATHER
The Roadblock • The study of mesoscale weather is stifled by rigid IT frameworks that cannot accommodate the • real time, on-demand, and dynamically-adaptive needs of mesoscale weather research; • its disparate, high volume data sets and streams; and • its tremendous computational demands, which are among the greatest in all areas of science and engineering • Some illustrative examples…
Traditional Methodology STATIC OBSERVATIONS Radar Data Mobile Mesonets Surface Observations Upper-Air Balloons Commercial Aircraft Geostationary and Polar Orbiting Satellite Wind Profilers GPS Satellites • Product Generation, • Display, • Dissemination Prediction/Detection PCs to Teraflop Systems • Analysis/Assimilation • Quality Control • Retrieval of Unobserved • Quantities • Creation of Gridded Fields • End Users • NWS • Private Companies • Students
Traditional Methodology STATIC OBSERVATIONS Radar Data Mobile Mesonets Surface Observations Upper-Air Balloons Commercial Aircraft Geostationary and Polar Orbiting Satellite Wind Profilers GPS Satellites • Product Generation, • Display, • Dissemination Prediction/Detection PCs to Teraflop Systems • Analysis/Assimilation • Quality Control • Retrieval of Unobserved • Quantities • Creation of Gridded Fields The Process is Entirely Serial and Static (Pre-Scheduled): No Response to the Weather! • End Users • NWS • Private Companies • Students
The LEAD Vision: No Longer Serial or Static STATIC OBSERVATIONS Radar Data Mobile Mesonets Surface Observations Upper-Air Balloons Commercial Aircraft Geostationary and Polar Orbiting Satellite Wind Profilers GPS Satellites • Product Generation, • Display, • Dissemination Prediction/Detection PCs to Teraflop Systems • Analysis/Assimilation • Quality Control • Retrieval of Unobserved • Quantities • Creation of Gridded Fields Models Responding to Observations • End Users • NWS • Private Companies • Students
10 km 3 km 1 km Model Dynamic Adaptivityt = to 20 km
10 km 3 km 10 km 3 km 3 km 3 km t = to + 6 Hours 20 km
Today’s Standard Computer Forecast Radar 12-hour National Forecast (coarse grid) Radar (Tornadoes in Arkansas)
Today’s Standard Computer Forecast Radar 12-hour National Forecast (coarse grid) Radar (Tornadoes in Arkansas)
Experimental Mesoscale Window Radar Radar 6-hour Mesoscale Forecast (medium grid) Radar (Tornadoes in Arkansas)
Experimental Mesoscale Window Radar Radar 6-hour Mesoscale Forecast (medium grid) Radar (Tornadoes in Arkansas)
Experimental Storm-Scale Window Radar 6-hour Local Forecast (fine grid) Xue et al. (2003)
11 h Forecast 20 June 2001 (6 km) Courtesy Weather Decision Technologies, Inc.
9 h Forecast 20 June 2001 (6 km) Courtesy Weather Decision Technologies, Inc.
5 h Forecast 20 June 2001 (6 km) Courtesy Weather Decision Technologies, Inc.
3 h Forecast 20 June 2001 (6 km) Courtesy Weather Decision Technologies, Inc.
LEAD: Users INTERACTING with Weather Mesoscale Weather
NWS National Static Observations & Grids LEAD: Users INTERACTING with Weather Mesoscale Weather
NWS National Static Observations & Grids Local Observations LEAD: Users INTERACTING with Weather Mesoscale Weather
NWS National Static Observations & Grids Users ADAS ADaM Tools Local Observations LEAD: Users INTERACTING with Weather Mesoscale Weather
NWS National Static Observations & Grids Virtual/Digital Resources and Services Users ADAS ADaM Tools MyLEADPortal Remote Physical (Grid) Resources Local Physical Resources Local Observations LEAD: Users INTERACTING with Weather Mesoscale Weather
NWS National Static Observations & Grids Virtual/Digital Resources and Services Users ADAS ADaM Tools MyLEADPortal Remote Physical (Grid) Resources Local Physical Resources Local Observations LEAD: Users INTERACTING with Weather Interaction Level I Mesoscale Weather
Traditional Methodology STATIC OBSERVATIONS Radar Data Mobile Mesonets Surface Observations Upper-Air Balloons Commercial Aircraft Geostationary and Polar Orbiting Satellite Wind Profilers GPS Satellites • Product Generation, • Display, • Dissemination Prediction/Detection PCs to Teraflop Systems • Analysis/Assimilation • Quality Control • Retrieval of Unobserved • Quantities • Creation of Gridded Fields Observing Systems OperateLargely Independent of the Weather – Little Adaptivity • End Users • NWS • Private Companies • Students
The Limitations of NEXRAD #1. Operates largely independentof the prevailing weather conditions
The Limitations of NEXRAD #1. Operates largely independentof the prevailing weather conditions #2. Earth’s curvature prevents 72% of the atmosphere below 1 km from being observed
The Limitations of NEXRAD #1. Operates largely independentof the prevailing weather conditions #2. Earth’s curvature prevents 72% of the atmosphere below 1 km from being observed #3. Operates entirely independent fromthe models and algorithms that use its data
The Consequence: 3 of Every 4 Tornado Warnings is a False Alarm Source: NWS Office of Science and Technology
The LEAD Vision: No Longer Serial or Static DYNAMIC OBSERVATIONS • Product Generation, • Display, • Dissemination Prediction/Detection PCs to Teraflop Systems • Analysis/Assimilation • Quality Control • Retrieval of Unobserved • Quantities • Creation of Gridded Fields Models and Algorithms Driving Sensors • End Users • NWS • Private Companies • Students
New NSF Engineering Research Center for Adaptive Sensing of the Atmosphere (CASA) • UMass/Amherst is lead institution • Concept: inexpensive, dual-polarization phased array Doppler radars on cell towers – existing IT and power infrastructures! • Adaptive dynamic sensing of multiple targets (“DCAS”)
New NSF Engineering Research Center for Adaptive Sensing of the Atmosphere (CASA) • UMass/Amherst is lead institution • Concept: inexpensive, dual-polarization phased array Doppler radars on cell towers – existing IT and power infrastructures! • Adaptive dynamic sensing of multiple targets (“DCAS”)
New NSF Engineering Research Center for Adaptive Sensing of the Atmosphere (CASA) • UMass/Amherst is lead institution • Concept: inexpensive, dual-polarization phased array Doppler radars on cell towers – existing IT and power infrastructures! • Adaptive dynamic sensing of multiple targets (“DCAS”)
Users LEAD: Users INTERACTING with Weather NWS National Static Observations & Grids Virtual/Digital Resources and Services ADAS ADaM Mesoscale Weather Tools MyLEADPortal Remote Physical (Grid) Resources Local Physical Resources Local Observations
Users Experimental Dynamic Observations LEAD: Users INTERACTING with Weather NWS National Static Observations & Grids Virtual/Digital Resources and Services ADAS ADaM Mesoscale Weather Tools MyLEADPortal Remote Physical (Grid) Resources Local Physical Resources Local Observations
Users Experimental Dynamic Observations LEAD: Users INTERACTING with Weather Interaction Level II NWS National Static Observations & Grids Virtual/Digital Resources and Services ADAS ADaM Mesoscale Weather Tools MyLEADPortal Remote Physical (Grid) Resources Local Physical Resources Local Observations
The LEAD Goal Restated • To create an integrated, scalable framework that allows analysis tools, forecast models, and data repositories to be used as dynamically adaptive, on-demand systems that can • change configuration rapidly and automatically in response to weather; • continually be steered by new data (i.e., the weather); • respond to decision-driven inputs from users; • initiate other processes automatically; and • steer remote observing technologies to optimize data collection for the problem at hand; • operate independent of data formats and the physical location of data or computing resources
CS Challenges/Barriers • Workflow • Dynamic/agile/reentrant • Data • Synchronization, fault-tolerance, metadata, cataloging, interchange, ontologies • Monitoring and performance estimation • Detection of vulnerabilities, recovery, autonomy • Mining • Grid functionality, scheduling, fault tolerance
Meteorology Challenges/Barriers • “Packaging” of complex systems (WRF, ADAS) • Fault tolerance • Continuous model updating for effective use of truly streaming observations • Storm-scale ensemble methodologies • Hazardous weather detections based upon gridded analyses versus use of “raw” sensor data alone • Dynamically adaptive forecasting (models and observations) – how good compared to current static methodologies?
LEAD Architecture User Interface LEAD Portal Crosscutting Services Desktop Applications Portlets Client Interface Application Resource Broker (Scheduler) Workflow Services Application & Configuration Services Configuration and Execution Services Data Services Catalog Services Resource Access Services Distributed Resources