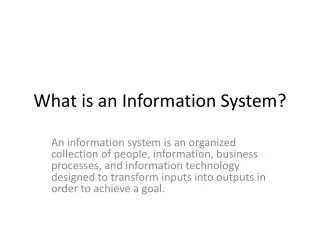
How to describe an information system
100 likes | 263 Vues
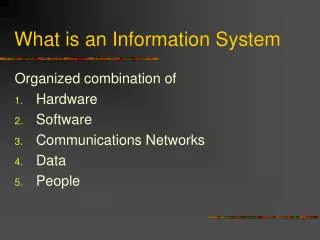
How to describe an information system. Chapter 12. STRUCTURE DIAGRAMS.

How to describe an information system
E N D
Presentation Transcript
How to describe an information system Chapter 12
STRUCTURE DIAGRAMS • Structure diagrams can be used to describe information systems. An overall task is broken down into smaller more manageable tasks. These may then be broken down further into smaller tasks. This way of describing tasks is described as the "top down" approach.
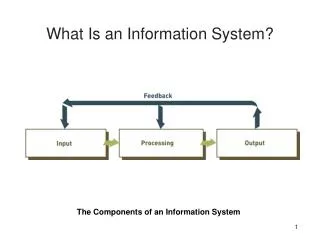
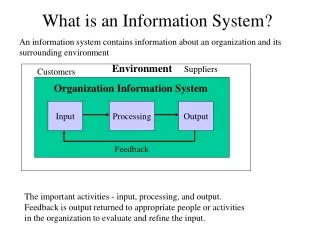
Dataflow diagram • A dataflow diagram shows how data moves through a system. It identifies where the data come from in the wider organisation, the processes the data pass through and where the data go to the wider organisation.
The box • The box is either a source of data, such as an order form from a customer, or a part of the system which uses or consumes the data, called a sink. We are not concerned with what happens to the data before it reaches the box if it is a source, or what happens to it after it goes past a sink.
The sausage • The sausage shape is sometimes replaced by a circle on some data flow diagrams and is used to denote a process performed on the data. A process is something which is done to the data like a calculation. The process might be sorting the data or combining it with some other data. A brief description of the process should be placed inside the box.
The open rectangle • The open rectangle represents a data store. This is where the data is held.
The arrows • The arrows are used to show how the other symbols are connected.
System flowchart • System flowchart is a diagram used to describe a complete data-processing system. It gives an overall view of the system. The flow of data through the operations is described diagrammatically, down to the level of the individual programs needed to achieve the system requirements.